This GSEB Class 12 Commerce Statistics Notes Part 1 Chapter 4 Time Series Posting covers all the important topics and concepts as mentioned in the chapter.
Time Series Class 12 GSEB Notes
Time Series :
1. Meaning:
The statistical data collected at certain interval of time and arranged in a chronological order is called time series, e.g., population of a country, agricultural production, wholesale price index number, data from share market, the hourly temperature in a city, etc. are presented with respect to time.
Time series consists of values of a variable associated with time.
2. Definition:
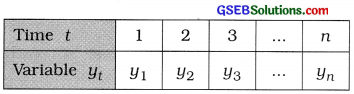
The set of values of a variable quantity (y) obtained at different points of time (t) is called a time series. Thus, time series = {yt, t = 1, 2, …, n}.
In a time series, t is an independent variable and yt is a dependent variable. We can write the time series in the following tabular form :
3. Importance:
The importance of the time series are as follows:
- The direction and pattern of variation in the values of the series can be known from the past data.
- The variations in the future can be estimated.
- Important decisions can be taken for future.
- Comparative study of data can be done.
- Industrial and government policies can be easily framed.
4. Uses:
The uses of the time series are as follows :
- Knowing the past situation to obtain the type and measure of the variation.
- To estimate the value of the variable in future.
- To take proper decision for the future.
- A comparative study can be carried out for the variations in the series.
- To find reasons for the discrepancies between the estimates and the present values.
![]()
Components of Time Series :
1. Long-Term Component or Trend: It is the measure of effect which prevails on the time series for a long period of time. Trend may be either increasing or decreasing or stable in terms of time. It represents the mathematical form and direction of variation taking place in the variable quantity yt of a given time series. It is denoted by the symbol Tt.
2. Seasonal Component: It represents the changes taking place in the variable quantity yt of time series at fixed period of time in the year (e.g., winter, summer, monsoon). It is short term in nature and denoted by the symbol St.
3. Cyclical Component: The variations arising due to boom and recession or business cycles in the variable quantity yt of time series are called the cyclical component. The duration of oscillation of cyclical variation varies from 10 to 20 years. It is denoted by the symbol Ct. Eliminating trend, seasonal component and random component from the variable quantity yt of time series, we can obtain the cyclical fluctuation.
Thus, Ct = yt – (Tt + St + Rt).
4. Random or Irregular Component: The fluctuations arising in the variable quantity yt of time series due to political, natural or random causes are called random or irregular component. It is denoted by the symbol Rr The component obtained by eliminating trend, seasonal fluctuations and cyclical fluctuations from the variable quantity yt of time series is a random or irregular component. Thus, Rt = yt – (Tt + St + Ct). This type of fluctuations are subject to uncontrollable forces and cannot be predicted in advance.
Methods for Determining Trend:
Trend is an important component of a time series. The main methods for determining trend are as follows :
1. Graphical Method: This is an easiest method for determining trend. Taking t on X-axis and time variable yt on Y-axis points are serially joined by linesegments a curve of time series is obtained. A curve passing through close to most of the points of time series curve is showing trend of the given time series. This method is not reliable for determining trend.
2. Method of Least Squares: This method for determining the trend is perfect mathematical and reliable. In this method trend is obtained for each value of t. To fit the equation of linear trend yt = a + bt, the values of ‘a’ and ‘b’ are obtained such that the sum of the squares of errors [Σei2 = X(yi — ŷi)2 = Z (y – a – bt)2] is minimum.
3. Method of Moving Average: This method determines trend values by eliminating the effect of short-term variations. The period of moving average is obtained by taking the average of oscillations of short term variations. By this method trend is not obtained for each t.
Important Formulae:
1. Least Square Method :
Equation of Linear Trend : ŷ = a + bt
Where, a and b are constants; t = Time:
ŷ = Time variable
a = \(\bar{y}-b \bar{t}\)
b = \(\frac{n \Sigma t y-(\Sigma t)(\Sigma y)}{n \Sigma t^{2}-(\Sigma t)^{2}}\)
Where, y = Time variable
t = Time
n = No. of t values
y = \(\frac{\Sigma y}{n}\)
\(\bar{t}=\frac{\Sigma t}{n}\)
2. Moving Average Method :
- ‘3’ yearly moving average = \(\frac{3^{\prime} \text { yearly moving total }}{3}\)
- ‘4’ yearly moving average = \(\frac{\text { Total of pairs of ‘ } 4 \text { ‘ yearly moving total }}{8}\)
- Where, Total of pairs of ‘4’ yearly moving total
= (‘4’ yearly moving total for t = 1, 2, 3, 4) + (‘4’ yearly moving total for t = 2, 3, 4, 5)
![]()
3. Additive Model of Time Series :
= Tt + St + Ct + Rt
Where, yt = Total variation of time series
Tt = Trend, St = Seasonal component,
Ct = Cyclical component,
Rt = Random component
- Trend ; Tt = yt – (St + Ct + Rt)
- Seasonal component: St = yt – (Tt + Ct + Rt)
- Cyclical component :Ct = yt– (Tt + St + Rt)
- Random component: Rt = yt – (Tt + St + Rt)