Gujarat Board Statistics Class 11 GSEB Solutions Chapter 3 Measures of Central Tendency Ex 3 Textbook Exercise Questions and Answers.
Gujarat Board Textbook Solutions Class 11 Statistics Chapter 3 Measures of Central Tendency Ex 3
Section – A
Choose the correct option from those given below each question:
Question 1.
Which average gets most affected by too large or too small values?
(a) Arithmetic mean
(b) Median
(c) Mode
(d) Geometric mean
Answer:
(a) Arithmetic mean
Question 2.
Which of the following will give us the value of median?
(a) D7
(b) Q1
(c) P45
(d) P50
Answer:
(d) P50
Question 3.
In which of the following situations, mean cannot be found?
(a) Class lengths are unequal,
(b) There are open ended class intervals,
(c) The number of class intervals is more than 5,
(d) Inclusive type of classes are used
Answer:
(b) There are open-ended class intervals,
![]()
Question 4.
For any set of observations, which of the following is true?
(a) x̄ ≤ G
(b) x̄ = G
(c) x̄ ≥ G
(d) x̄ > G
Answer:
(c) x̄ ≥ G
Question 5.
Which of the following results is true for the data that are evenly distributed around average?
(a) x̄ = M = M0
(b) x̄ > M > M0
(c) x̄ < M < M0
(d) x̄ < M > M0
Answer:
(a) x̄ = M = M0
Question 6.
If the mean of 10 observations is 15, what is the sum of observations?
(a) 25
(b) 150
(c) 5
(d) 1.5
Answer:
(b) 150
Question 7.
If Σ (x – 9) = 0 for data having 5 observations, then what is the value of mean?
(a) x̄ = 0
(b) x̄ = 5
(c) x̄ = 9
(d) x̄ = 45
Answer:
(c) x̄ = 9
Question 8.
What is the mode of observations 7, 9, 9, 1, 7, 9, 4, 9, 1?
(a) 1
(b) 4
(c) 7
(d) 9
Answer:
(d) 9
Question 9.
In a set of 50 observations, what is the median?
(a) Value of 25th observation
(b) Value of 26th observation
(c) Value of 25.5th observation
(d) Value of 26.5th observation
Answer:
(c) Value of 25.5th observation
Question 10.
What is the geometric mean of 4 and 9?
(a) 4
(b) 6
(c) 6.5
(d) 36
Answer:
(b) 6
Question 11.
If mean for a variable is 15 and its median is 20, what is the mode using empirical formula?
(a) 30
(b) 5
(c)35
(d) 17.5
Answer:
(a) 30
Question 12.
The median of 10 observations is 14. What will be the median of observations obtained when each observation gets doubled?
(a) 10
(b) 28
(c) 7
(d) 1.4
Answer:
(b) 28
Question 13.
All the observations in a data are of same value 16. What will be their mode?
(a) 8
(b) 2
(c) 16
(d) 4
Answer:
(c) 16
![]()
Question 14.
Which of the following statements is false?
(a) The quartiles divide the data in 4 equal parts.
(b) The mean divides the data in 2 equal parts.
(c) The percentiles divide the data in 100 equal parts.
(d) The deciles divide the data in 10 equal parts.
Answer:
(b) The mean divides the data in 2 equal parts.
Question 15.
The lengths (in meters) of 6 pipes manufactured ‘ by a company are as follows:
1.05, 1.15, 0.98, 1.12, 0.89, 0.95 Which of the following statements is true?
(a) Mode = 1 m
(b) Mode = 1.15 m
(c) Mode 0.98 m
(d) Mode cannot be found.
Answer:
(d) Mode cannot be found.
Section – B
Answer the following questions in one sentence:
Question 1.
State any one advantage of mean.
Answer:
The value of mean is based on all the observations of the data.
Question 2.
If observations have varying importance, which average should be used?
Answer:
If observations have varying importance, weighted average should be used.
Question 3.
Name any two positional averages.
Answer:
TWo positional averages are :
- Median and
- Quartiles.
Question 4.
State the empirical relation between mean, median and mode.
Answer:
The empirical relation between mean, median and mode is M0 = 3M – 23c.
Where, M0 = Mode; M = Median; 3c – Mean.
Question 5.
State the condition under which geometric mean cannot be found.
Answer:
When the value of any one variable is either zero or negative, then geometric mean cannot be found.
Question 6.
Define mode.
Answer:
The value that occurs maximum number of times in the given data is called mode. It is denoted by M0.
Question 7.
State the name of the statistician who gave the empirical formula between mean, median and mode.
Answer:
The noted statistician Karl Pearson gave the empirical formula between mean, median and mode.
Question 8.
Median of 10 observations is 55. If the value of the largest observation increases from 100 to 110, find the new median.
Answer:
n = 10, M = 55. The largest observation increases from 100 to 110. The value of median is free from the effect of extreme values. Therefore, the new value of median remains same as 55.
![]()
Question 9.
Mean of variable x is 9. What is the mean of the variable y = x + 4?
Answer:
x̄ = 17, y = x – 4
∴ y = x̄ – 4
= 17 – 4 = 13
Question 10.
Find the modal value of the variable having the following frequency distribution:

Answer:
Mode M0= Observation having a maximum frequency 48
∴ M0 = 10
Question 11.
Arithmetic mean of two numbers is 5. If one number is 6, find the other number.
Answer:
Suppose, another number is x2
x̄ = \(\frac{6+x_{2}}{2}\)
∴ 5 = \(\frac{6+x_{2}}{2}\)
∴ 10 = 6 + x2
∴ x2 = 10 – 6 = 4
Hence, another number = 4.
Question 12.
Find first quartile for variable with observations 15, 4, 7, 20, 2, 7, 13.
Answer:
Arranging the observations in ascending order: 2, 4, 7, 7, 13, 15, 20 , Here, n = 7.
First quartile Q1 = Value of \(\left(\frac{n+1}{4}\right)\)th observation
= Value of \(\left(\frac{7+1}{4}\right)\)
= 2nd observation
∴ Q1 = 4.
Question 13.
Which average can be obtained if the continuous frequency distribution has open ended classes?
Answer:
If the continuous frequency distribution has open ended classes median can be obtained as an average.
Question 14.
If 9s = 25.75 for a variable, then find p75
Answer:
Q3 = 25.75
∴ P75 = Q3 = 25.75
Question 15.
The median of daily demand of a vendor is 15. If he sells each item for ₹ 10, find the median of his revenue?
Answer:
M = 15,
The value of each item = ₹ 10
Therefore, median income of item= ₹ (15 × 10)
= ₹ 150
Hence, median income = ₹ 150.
Section – C
Answer the following questions as required:
Question 1.
Define weighted mean
Answer:
When the importance of all the observations of the data is not equal, then by assigning weightage to each observation in proposition to its importance, the mean obtained is called weighted mean. It is denoted by x̄w.
Suppose the weights assigned to observations x1, x2,…. xn are respectively w1, w2, …, wn then
weighted mean x̄w = \(\frac{w_{1} x_{1}+w_{2} x_{2}+\ldots+w_{n} x_{n}}{w_{1}+w_{2}+\ldots+w_{n}}\)
= \(\frac{\Sigma w x}{\Sigma w}\)
Question 2.
Explain what is meant by measure of central tendency.
Answer:
- In classified data the values of variable are cancentrated around a certain central value. This characteristic of data is called as Central Tendency.
- The central value around which the values of the variable are concentrated is called as measure of central tendency.
![]()
Question 3.
State the advantages of mode.
Answer:
The advantages of mode are as follows :
- Mode is easy to understand and calculate.
- Its value can be found merely by inspection.
- Its value is not affected by too large or too small values.
- It can be found graphically.
Question 4.
Explain the combined mean.
Answer:
- If the number of observations and mean of two or more groups are given, then the mean of the combined group is called the combined mean. It is denoted by x̄c.
- If the number of observations and mean of two or more groups are given, then the mean of the combined group is called the combined mean. It is denoted by x̄c.
Suppose, k groups having the observations n1, n2,…,nk have means respectively x1, x2,…. xk, then their combined mean is obtained as follows :
x̄c = \(\frac{n_{1} \bar{x}_{1}+n_{2} \bar{x}_{2}+\ldots+n_{k} \bar{x}_{k}}{n_{1}+n_{2}+\ldots+n_{k}}\)
Question 5.
Which type of data have median as a better measure of central tendency than mean?
Answer:
- When the data given is of qualitative nature, median is better measure of central tendency than mean.
- If the observations of the data are not uniformly distributed around the average, then median is better than mean.
- When continuous frequency distribution has open ended classes median is a better measure of central tendency than mean.
Question 6.
What are the factors to be considered while choosing an appropriate average?
Answer:
While choosing an appropriate average the following factors are to be considered:
- The nature of data
- The nature of variable involved
- The purpose of study
- The type of classification used and
- The need of average for further stastical analysis.
Question 7.
The mean and mode of a variable are 5.5 and 6.4 respectively. Find its median.
Answer:
x̄ = 5.5, M0 = 6.4, M = ?
Using the empirical formula,
M0 = 3M – 2x̄
∴6.4 = 3M – 2(5.5)
∴ 6.4 + 11.0 = 3M
∴ M = \(\frac{17.4}{3}\) = 5.8
Question 8.
Geometric mean of two numbers is 8. If one number is 4, find the other number.
Answer:
G = 8, x1 = 4.
G = \(\sqrt{x_{1} \cdot x_{2}}\)
∴ 8 = \(\sqrt{4 \times x_{2}}\)
∴ 64 = 4x2
∴ x2 = \(\frac{64}{4}\) = 16
Hence, another number is 16
Question 9.
Mean weekly production (x) of factory is 81 units. Find the mean production cost if cost is given by y = 3x + 50.
Answer:
Mean of production (x) x = 81 Production cost y = 3x + 50
∴ Mean of production cost y = 3x + 50 Putting x̄ = 81,
ȳ = 3 (81) + 50 = 243 + 50 = 293
Question 10.
The median of observations a – 5, a + 1, a + 2, a – 3, a is 10. Find a.
Answer:
Arranging the observations in ascending order, a – 5, a – 3, a, a + 1, a + 2
Here, n = 5 and M = 10.
M = Value of \(\left(\frac{n+1}{2}\right)\)th observation
∴ 10 = Value of \(\left(\frac{5+1}{2}\right)\) = 3rd observation
∴ 10 = a
Hence a = 10
Question 11.
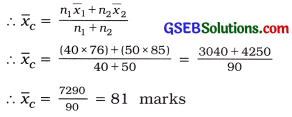
The mean of marks in Mathematics of 40 students in class is 76, whereas the same for the other class of 50 students is 85. Find the mean of marks in Mathematics of students in both the classes together.
Answer:
Here, n1 = 40; x̄1 = 76; n2 = 50: x̄2 = 85
Mean of marks of mathematics of the students of both class is combined mean.
Question 12.
The number of vehicles per family In families residing in’ a certain area are given in the following table. Find the mean for the number of vehicles.

Answer:
| No. of vehicles v | No. of families f | Cumulative frequency cf |
| 0 | 2 | 2 |
| 1 | 4 | 6 |
| 2 | 9 | 15 |
| 3 | 7 | 22 |
| 4 | 3 | 25 |
| Total | n = 25 | – |
Median of number of vehicles:
M = Value of \(\left(\frac{n+1}{2}\right)\)th observation
= Value of \(\left(\frac{25+1}{2}\right)\)
= 13th observation,
Referring to cf column.
M = 2 vehicles
Hence, median of number of vehicles = 2 vehicles.
![]()
Question 13.
Find the weighted mean of variable x from the following data:
| Variable x | 1500 | 800 | 200 |
| Weight w | 5 | 4 | 1 |
Answer:
| Variable x | Weight w | wx |
| 1500 | 5 | 7500 |
| 800 | 4 | 3200 |
| 200 | 1 | 200 |
| Total | Σm = 10 | Σwx = 10,900 |
Weight mean of x:
x̄ = \(\frac{\Sigma w x}{\Sigma w}\)
= \(\frac{10900}{10}\)
= 1090
Hence, weighted mean of x = 1090
Section D
Answer the following questions as required:
Question 1.
State the characteristics of an ideal average.
Answer:
The characteristics of an ideal average are as follows ;
- It should be well defined, clear and precise.
- It should be easy to understand and calculate.
- It should be based on all the observations of the data.
- It should be suitable for further algebric operations.
- It should be a stable measure, i.e, it should be free from sampling effects.
- It should not be unduly affected by too large or too small observations.
- It should be widely used in data analysis.
Question 2.
Define geometric mean and state its advantages.
Answer:
If n observations x1, x2, …, xn of the data are positive and non-zero, then nth root of the product of these observations is called geometric mean. It is denoted by G. Its formula Is as follows :
G = \(\sqrt[n]{x_{1} \cdot x_{2} \cdot \ldots \cdot x_{n}}\)
Advantages of Geometric mean:
- It is rigidly defined.
- It is based on all observations of the data.
- It is a stable measure.
- It is suitable for algebric process.
- It balances the effect of too large or too small observations of the data and its value is less than mean.
Question 3.
Explain the use of mode as a measure of central Tendency.
Answer:
In day to day practice, many times we state like, on an average the daily wage of workers of a factory is ₹ 110. On an average the daily production of a company is 50 units, the average life of a person in our country is 70 years, etc. In all these statements the context of the measure of an average is to the observation that occurs maximum number of time. It indicates a general value of observations. Such general value representing the average indicates the value of mode.
Thus, the value of observation occuring the maximum number of time in the data is called mode. It is denoted by Mc.
Question 4.
Explain the positional averages briefly.
Answer:
If the observations of the data are not distributed around the average, then mean is not good representative measure of observations of the data. In this circumstances to know the characteristic of the data at various places, considering the observations related to particular place of the data, the measure of average is obtained. Such measure of average is known as the positional average.
Median is such a positional average. Besides this Quartiles, Deciles and Percentiles are also the measures of the positional average.
Median: The value of observation dividing the observations of the data arranged in ascending or descending order of magnitudes into two equal parts is called median of the data. It is denoted by M. It represent the average value of 50 % of observations.
guartiles: The values of observations dividing the sequence of observations of a given data arranged in the increasing or decreasing order of their magnitudes, into four equal parts are called
Quartiles:
There are three Quartiles and they are symbolically denoted as Q1, Q2, and Q3.
Deciles:
The values of observations dividing the observations of a given data arranged in increasing or decreasing order of their magnitudes in ten equal parts are called Deciles. There are 9 deciles. They are denoted by the symbol D1; D2, D3, …, D9.
Percentiles:
The values of observations dividing the observations of a given data arranged in increasing or decreasing order of their magnitudes in hundred equal parts are called Percentiles. There are 99 Percentiles. They are denoted by symbol P1, P2, P3, …, P99.
Question 5.
Compare mean and median as the measures of central tendency.
Answer:
| Mean | Median |
| 1. It is a mathematic average. | 1. It is a positional average. |
| 2. It is the value obtained by dividing the, sum of observations by the dumber of observations. | 2. It is the middle most value of the observations arranged in order. |
| 3. It is an ideal measure of average for numerical data. | 3. It is a convenient measure of average for qualitative data. |
| 4. Its value is affected by too large or too small observations of the data. | 4. Its value is not affected by too large or too small observations of the data. |
| 5. It cannot be obtained for open ended frequency distribution. | 5. It can be obtained for open-ended frequency distribution. |
| 6. It is a suitable measure for further algebric operations. | 6. It is not convenient measure of average for algebric operations. |
| 7. It is obtained when the observations of the data are uniformly distributed around a central value. | 7. It is convenient measure of average when the observations of the data are not distributed uniformaly around a central value. |
Question 6.
Which average is called as optimum average? Why?
Answer:
Among all the measures of average, the mean is called as optimum average because
- The value of mean satisfies many of the characteristics of an ideal average. Therefore it is widely, use for the analysis of statistical data.
- It is the exclusive characteristic of mean that it is most convenient measure of average for special algebric operations.
- To study the various characteristics of population or to compare two or more popula¬tions, as a measure of average only mean is used in advanced statistical methods.
Question 7.
The economy growth rates of a state for four consecutive years are 2 %, 2.5 %, 3 %, 4 % respectively. Find the average growth rate using an appropriate average.
Answer:
Rate of economic growth is given in percentage. Therefore, an appropriate measure of average is geometric mean.
x1 = 100 + 2 = 102,
x2 = 100 + 2.5 = 102.5,
x3 = 100 + 4 = 104,
x4 = 100 + 3 = 103
Average growth rate:
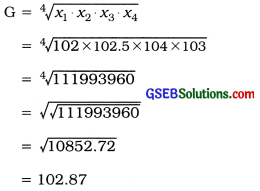
Hence, average growth rate of economic = (102.87 – 100)
= 2.87 %
Question 8.
Find D7 and P15 from the following data about daily sales of a mobile phone shop and interpret them:

Answer:
| No. of phones x | No. of days f | Cumulative frequency cf |
| 4 | 3 | 3 |
| 6 | 9 | 12 |
| 7 | 15 | 27 |
| 8 | 23 | 50 |
| 10 | 8 | 58 |
| 12 | 2 | 60 |
| Total | n = 60 | – |
Seventh decile:
D7 = Value of \(\left(\frac{n+1}{10}\right)\)th observation
= Value of 7\(\left(\frac{61}{10}\right)\)
= Value of 7 (6.1)
= 42.7th observation Referring to column cf,
D7 = 8 mobile phones
Fifteenth Percentile:
P15 = Value of 15\(\left(\frac{n+1}{100}\right)\)th observation
= Value of 15\left(\frac{60+1}{100}\right)
= Value of 15(0.61)
= 9.15th observation
Referring to column cf,
P15 = 6 mobile phones
Interpretation:
- D7 = 8 phones. Therefore, the sale of mobile phones of 70 % of days will be 8 or less phones.
- P15 = 6 phones. Therefore, the sale of mobile phones of 15 % of days will be 6 or less phones.
Question 9.
The mean perfume content in the bottles filled by a perfume manufacturer’s machine should be between 29.6 ml and 30.4 ml. The 7 bottles tested had the following perfume contents (in ml) :
30.2, 28.9, 29.2, 30.1, 29.4, 31.3, 31.4 Is the machine working properly?
Answer:
We find the mean of quantity of perfumes in 7 bottles.
x̄ = \(\frac{\sum x}{n}\)
= \(\frac{30.2+28.9+29.2+30.1+29.4+31.3+31.4}{7}\)
= \(\frac{210.5}{7}\) = 30.07ml
The mean of quantity of perfumes 30.07 ml is in the interval 29.6 to 30.4. Therefore, machine works properly.
![]()
Question 10.
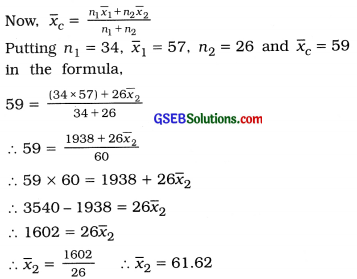
The mean of marks scored by 34 boys in a class is 57. The mean of marks of all 60 students of the class is 59. Find the mean marks scored by the girls.
Answer:
Here, n1 = No. of boys = 34
n2 = No. of girls = Total number of students – 34 = 60 – 34 = 26
x̄1 = Mean of marks of boys = 57
x̄2 = Mean of marks of girls =?
x̄c = Mean of marks of students = 59
Question 11.
The mean of 50 observations is 35. Later on, it was known that the value of one observation was taken as 50, whIch was wrong. Find the mean of remaining observations by excluding the wrong observation.
Answer:
Here, n = 50; x̄ = 35
∴ Sum of 50 observatIons = n
= 50 × 35 = 1750
We have to find mean of the remaining observations after cancelling the wrong observation taken in calculation.
∴ n = 50 – 149
Sum of 49 observations = 1750 – 50 = 1700
∴ Mean of remaining observations = 1700
= 34.69
Question 12.
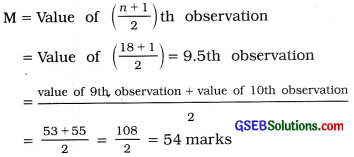
3 students from a group of 18 students failed in the examination for the subject of Economics. The marks obtained by the 15 students who passed are as follows:
![]()
Find the median marks of all 18 students.
Answer:
Suppose marks of 3 students who fail are x1, x2, x3. Usually, these marks will be less than the marks of the students who pass. Therefore, 18 observations are arranged in ascending order as follows :
x1, x2, x3, 42, 43, 48, 50, 51, 53, 55, 57, 61, 64, 65, 68, 70, 75, 79
Here, n = 18
Median of marks of the student:
Hence, the mean of marks scored by girls = 61.62 marks.
Question 13.
The mean daily sale of a company is 126.2 units. The sales on 10 days after adopting a new advertising strategy are as follows:
![]()
Can we say that mean sale has increased by new advertising strategy?
Answer:
Mean of daily sales = 126.2 Units Mean of daily sales after the new policy of advertisement,

Due to new policy of advertisement, the mean of daily sales has been increased from 126.2 units to 138.9 units. Therefore, it can be said that due to new policy of advertisement the daily sales has been increased.
Section – E
Solve the following:
Question 1.
The following table shows the number of units of electricity consumption of different families:

Find the median consumption.
Answer:
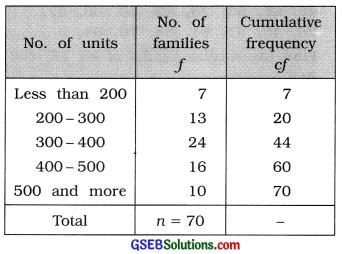
Median of the number of units of consumption:
M class = Class that includes \(\left(\frac{n}{2}\right)\)th observation
= Class that includes \(\left(\frac{70}{2}\right)\) = 35th observation
Referring to column cf, M class = 300 – 400
Now, M = \(\frac{\left(\frac{n}{2}\right)-c f}{f}\) × c
Putting L = 300, \(\left(\frac{n}{2}\right)\) = 35, cf = 20, f = 24 and c = 100 in the formula,
M = 300 + \(\frac{35-20}{24}\) × 100
= 300 + \(\frac{15 \times 100}{24}\) = 300 + 62.5 = 362.5 units
Hence, median of the number of units of consumption = 362.5 units.
Question 2.
The weekly profit and loss information of a vendor is available as follows. Find the modal profit:

Answer:
| Profit (thousand ₹) | No of weeks f |
| -2 – 0 | 4 |
| 0 – 2 | 8 = f1 |
| 2 – 4 | 14 = fm |
| 4 – 6 | 6 = f2 |
| 6 – 8 | 2 |
| 8 – 10 | 1 |
Mode of profit:
M0 class = Class having maximum frequency 14
= 2 – 4

Hence, mode of profit = ₹ 2.86 thousand.
Question 3.
The number of bags of wheat sold in a grocer’s shop each day are shown in the following table :

Find Q1 and Q4 for the number of bags sold.
Answer:
| No. of bags | No. of days f | ’ Cumulative frequency cf |
| 25 – 29 | 9 | 9 |
| 30 – 34 | 17 | 26 |
| 35 – 39 | 32 | 58 |
| 40 – 44 | 24 | 82 |
| 45 – 49 | 10 | 92 |
| 50 – 54 | 5 | 97 |
| 55 and more | 3 | 100 |
| Total | n = 100 | – |
First Quartile:
Q1 class = Class that Includes \(\left(\frac{n}{4}\right)\)th observation
= Class that includes \(\left(\frac{100}{4}\right)\)
= Class that includes 25th observatIon
Referring to column cf, Q1 class = 30 – 34
In exclusive form. Q1 class = 29.5 – 34.5
Now, Q1 = L + \(\frac{\left(\frac{n}{4}\right)-c f}{f}\)
Putting L = 29.5. \(\left(\frac{n}{4}\right)\) = 25. cf = 9, f = 17 and
c = 5 In the formula,
Q1 = 29.5+ \(\frac{25-9}{17}\) × 5
= 29.5 + \(\frac{16 \times 5}{17}\)
= 29.5 + 4.71 = 34.21 bags
Hence, first quartile Q1 = 34.21 bags.
Fourth Decile:
D4 class = Class that includes 4\(\left(\frac{n}{10}\right)\)th observation
= Class that includes 4\(\left(\frac{100}{10}\right)\)
= Class that includes 40th observation
Referring to column cf. D4 class = 35 – 39
In exclusive form. D4 class = 34.5 – 39.5
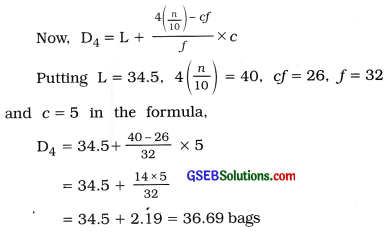
Hence, fourth decile D4 = 36.69 bags.
![]()
Question 4.
The heights of students of a college are given in the following table. Find the mean height of the students.

Answer:
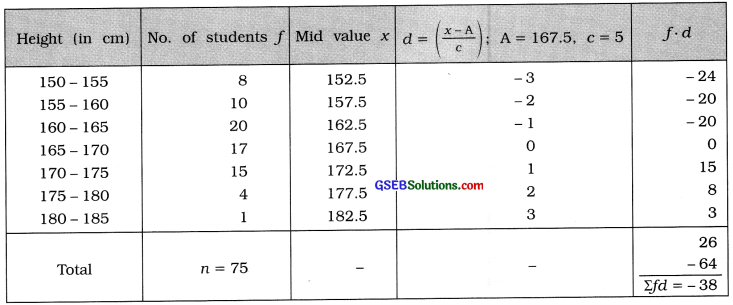

Hence, mean of height = 164.97 cm
Question 5.
The monthly Income (In thousand ₹) of 130 persons living in a certain area is as follows:

Find the median of Income.
Answer:
The given frequency distribution Is of unequal length.
| Income (thousand ₹) | No. of persons f | Cumulative frequency cf |
| less than 4 | 6 | 6 |
| 4 – 8 | 14 | 20 |
| 8 – 12 | 31 | 51 |
| 12 – 20 | 35 | 86 |
| 20 – 28 | 28 | 114 |
| 28 – 36 | 16 | 130 |
| Total | n = 130 | – |
Median of Income:
M class = Class that Includes \(\left(\frac{n}{2}\right)\)th observation
= Class that includes \(\left(\frac{130}{2}\right)\)
= Class that Includes 65th observation
Referring to column of cf, M class = 12 – 20
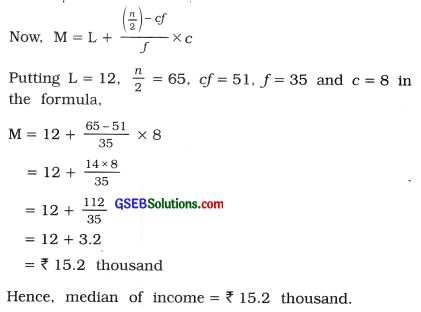
Question 6.
The data about population (in thousands) of 70 villages in a district is given in the following table :

Find the mode for the population using graphical method.
Answer:
We will find the value of mode by drawing histogram of the given frequency distribution.
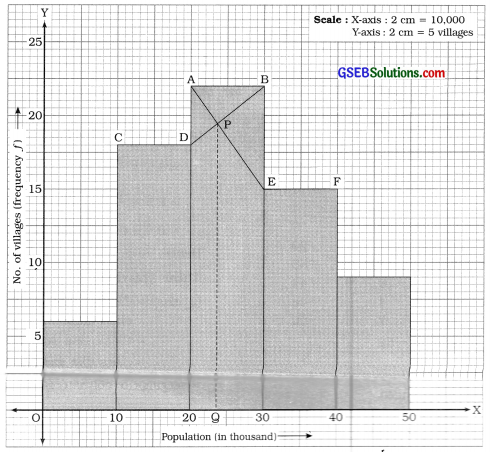
From histogram mode = OQ = 23 thousand.
Hence, mode of population = 23 thousand.
Question 7.
The marks obtained by 60 students in an examination are as follows. Find the mean marks of the students.

Answer:
For the first two classes c = 10 and after that c = 5.
Therefore, taking d = \(\frac{x-\mathrm{A}}{5}\) . we calculate mean.
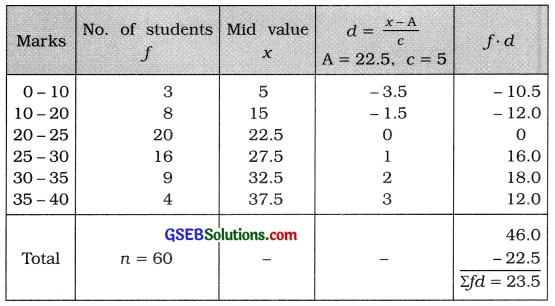
Mean of marks :
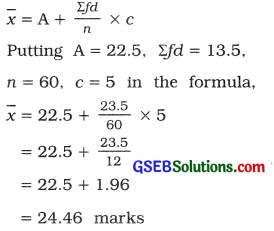
Hence, mean of marks = 24.46 marks.
Question 8.
A survey was conducted for 50 employees in an office regarding their computer usage time.
The details are shown In the following table:

Find the quartiles Q1 and Q3 for the time for the usage of computer.
Answer:
|
Time of use of computers (hours) |
No. of employees f |
Cumulative frequency cf |
| 5 – 5.5 | 1 | 1 |
| 5.5 – 6 | 3 | 4 |
| 6 – 6.5 | 5 | 9 |
| 6.5 – 7 | 11 | 20 |
| 7 – 7.5 | 15 | 35 |
| 7.5 – 8 | 9 | 44 |
| 8 – 8.5 | 4 | 48 |
| 8.5 – 9 | 2 | 50 |
| Total | n = 50 | – |
First Qualille:
Q1 class = Class that Included \(\left(\frac{n}{4}\right)\)th observation
= Class that includes \(\left(\frac{50}{4}\right)\)
= Class that includes 12.5th observatIon
Referring to column cf Q1 class 6.5 – 7
Now, Q1 = L + \(\frac{\left(\frac{\mathrm{n}}{4}\right)-c f}{f}\) × c
Putting L = 6.5, \(\left(\frac{n}{4}\right)\) = 12.5. cf = 9, f = 11 and c = 0.5 in the formula.
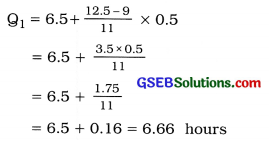
Third Quartile:
Q3 class = Class that includes 3 \(\left(\frac{n}{4}\right)\)th observation
= Class that Includes 3 (12.5)
= Class that includes 37.5th observation
Referring to column cf, Q3 class = 7.5 – 8
Now, Q3 = L + \(\frac{3\left(\frac{n}{4}\right)-c f}{f}\) × c
PuttIng L = 7.5, 3\(\left(\frac{n}{4}\right)\) = 37.5. cf = 35, f= 9 and c = 0.5 in the formula,

Hence, third quartile Q3 = 7.64 hours.
Section – F
Solve the following:
Question 1.
The data about marks scored by 55 students from a school are given below:

(i) If 30 % students failed in the examination, what are the passing marks?
(ii) If top 5% students are to be selected for scholarship, find the lowest marks for scholarship?
Answer:
| Marks | No. of students f | Cumulative frequency cf |
| 0 – 10 | 4 | 4 |
| 10 – 20 | 7 | 11 |
| 20 – 30 | 11 | 22 |
| 30 – 40 | 14 | 36 |
| 40 – 50 | 9 | 45 |
| 50 – 60 | 7 | 52 |
| 60 – 70 | 3 | 55 |
| Total | n = 55 | – |
(i) If 30 % of students are failed, their marks are D3 or less.
Now D3 class = Class that includes 3\(\left(\frac{n}{10}\right)\)th observation
= Class that includes 3\(\left(\frac{55}{10}\right)\)
= Class that includes 3 (5.5)
= Class that includes 16.5th observation
Referring to column cf, D3 class = 20 – 30
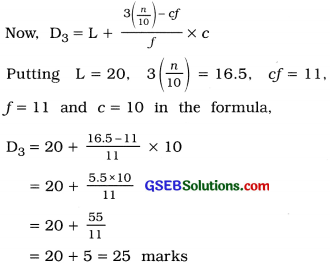
Hence, maximum marks of the student who fails will be 25.
The marks required for passing Is 26.
(ii) Scholarship Is to be given to the 5 % of students obtaining maximum marks. Therefore. minimum marks required for scholarship is P95.
P95 class = Class that Includes 95\(\left(\frac{n}{100}\right)\) observation
= Class that Includes 95\(\left(\frac{55}{100}\right)\)
= Class that Includes 95 (0.55)
= Class that includes 52.25th observation
Referring to column cf, P95 class = 60 – 70
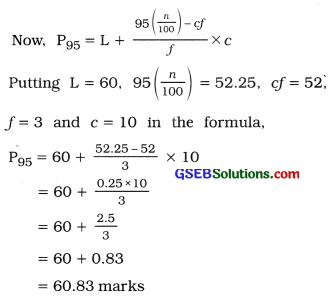
Hence. the minimum marks of the 5% students getting scholarship is 60.83 marks.
![]()
Question 2.
Two brands of tyres are to be compared for their mean life. The following data are available:

On the basis of mean, which brand of tyres is better?
Answer:
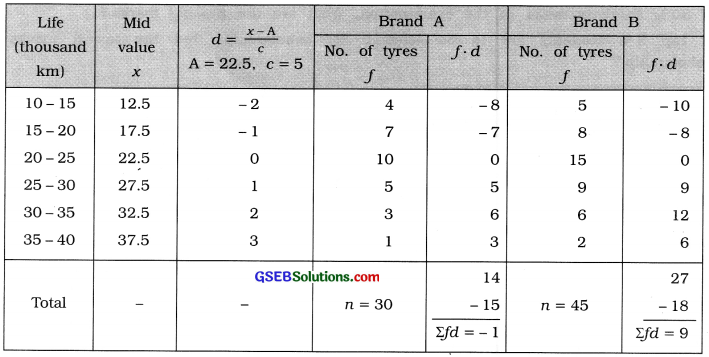

For brand A tire: x̄ = 22.33 thousand km;
For brand B tire: x̄ = 23.5 thousand km
Hence, brand B tyres are better than brand A tyres.
Question 3.
The distribution of sale of cars of a company on different days is as follows. Find the mode for the number of cars sold using an appropriate formula.

Answer:
The given data is the frequency distribution of mixure of discrete data and classes of continuous data. Therefore, we find mode by using the emperical formula of mode M0 = 3M – 2x.
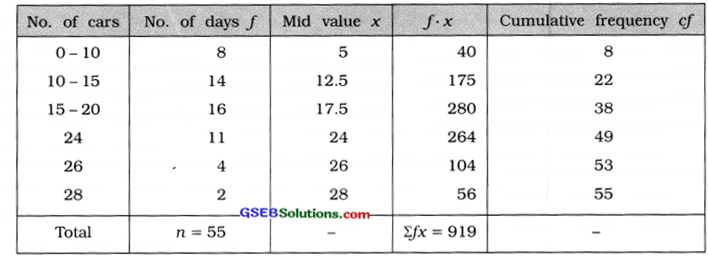
Median:
x̄ = \(\frac{\Sigma f x}{n}=\frac{919}{55}\) = 16.71 cars
Median:
M class = Class that includes \(\left(\frac{n}{2}\right)\)th observation
= Class that includes \(\left(\frac{55}{2}\right)\)
= 27.5th observation
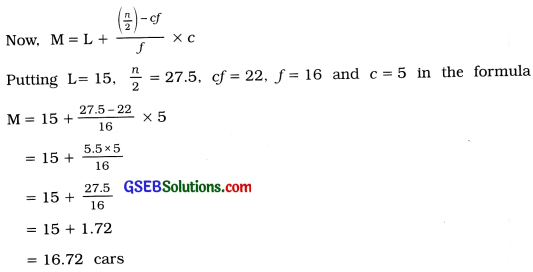
Referring to column cf, M class = 15 – 20
Mode :
M0 = 3M – 2x̄
Putting M= 16.72 and x̄ = 16.71 in the formula,
M0 = 3 (16.721 – 2 (16.71) = 50.16 – 33.42 = 16.74 cars
Hence, mode of cars sold = 16.74 cars.
Question 4.
The wheat crop grown per acre by farmers in different parts of a state is given below:

Find the mean and median for the wheat crop per acre.
Answer:
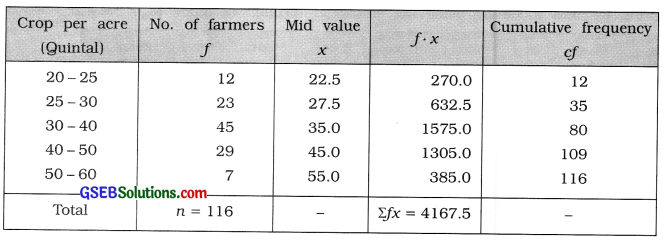
Take note that the class length of initial two classes is 5 and there after it is 10.
Mean:
x̄ = \(\frac{\Sigma f x}{n}=\frac{4167.5}{116}\) = 35.93 quintals
Median:
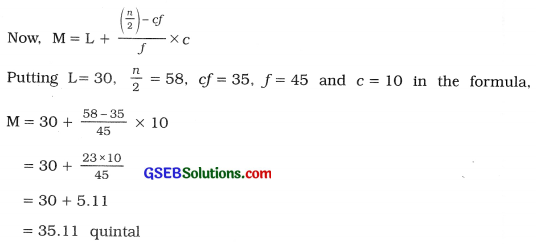
M class = Class that includes \(\left(\frac{n}{2}\right)\)th observation
= Class that includes \(\left(\frac{116}{2}\right)\)
= 58th observation
Referring to colunm cf, M class = 30 – 40
![]()
Question 5.
The distribution of age of 150 spectators In a theatre is as follows:

Find the mode for age of spectators using graphical method.
Answer:
The given frequency distribution is of unequal length. Therefore, we obtain proportionate frequency of each class as follows. Minimum class length is 5.
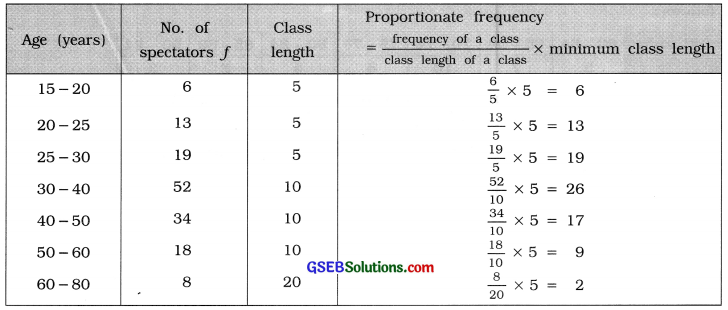
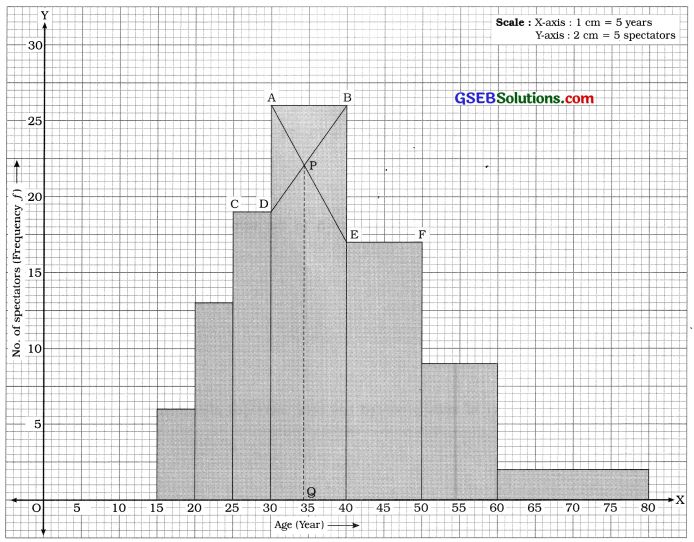
From the histogram mode = OQ = 34 years Hence, the mode of age of spectators = 34 years.
Question 6.
A producer believes that the mode of his daily production is 70. The distribution of production from the data obtained after making some changes in the design of the produced units is as follows :

Is there any change in the mode of the number of items produced?
Answer:
Given that mode of production = 70 units.
We will find mode of the production distribution after changing the design of production unit.
| No. of units | No. of days f |
| 60 – 64 | 5 |
| 65 – 69 | 7 = f1 |
| 70 – 74 | 10 = fm |
| 75 – 79 | 8 = f2 |
| 80 – 84 | 5 |
| 85 – 89 | 3 |
| 90 – 94 | 3 |
Mode of production :
M0 class = Class having maximum frequency 10 = 70 – 74
In exclusive form, M0 class = 69.5 – 74.5
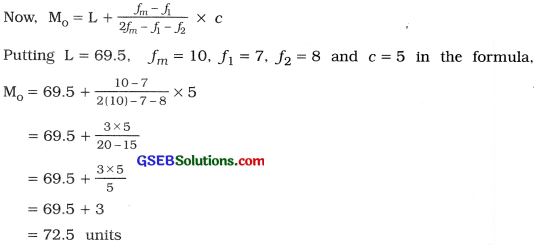
Hence, the mode of number of units produced has been increased after change in production design.
Question 7.
The data for sales of oil tins of two companies sold in a shop are as follows, which show the sales of 40 days:

If median is used to compare the sales, which company can be said to have higher sale?
Answer:
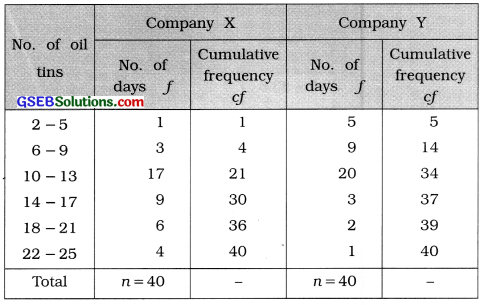
Company X:
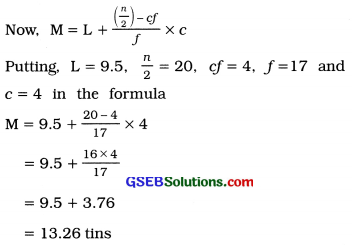
M class = Class that includes \(\left(\frac{n}{2}\right)\)th observation
= Class that Includes \(\left(\frac{40}{2}\right)\)
= 20th observation
Referring to column cf. M class = 10 – 13
In exclusive from, M class = 9.5 – 13.5
Company Y:
M class = Class that includes \(\left(\frac{n}{2}\right)\)th observation
= Class that includes \(\left(\frac{40}{2}\right)\)
= 20th observation
Referring to column cf M class = 10 -13
In exclusive form, M class = 9.5 – 13.5
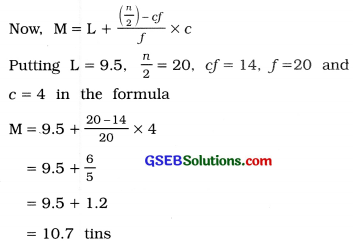
For company X median of sales = 13.26 tins
For company Y median of sales =10.7 tins
Hence, the sale of company X is more than the sale of company Y.
Question 8.
The distribution of age (in complete years) at the time of marriage of 50 married men is as follows:

Find the mode of their age at the time of marriage using graphical method.
Answer:
We draw histogram after converting inclusive continuous frequency distribution into exclusive form.
| Age (years) | No. of males f |
| 20.5 – 23.5 | 6 |
| 23.5 – 26.5 | 21 |
| 26.5 – 29.5 | 15 |
| 29.5 – 32.5 | 6 |
| 32.5 – 35.5 | 2 |
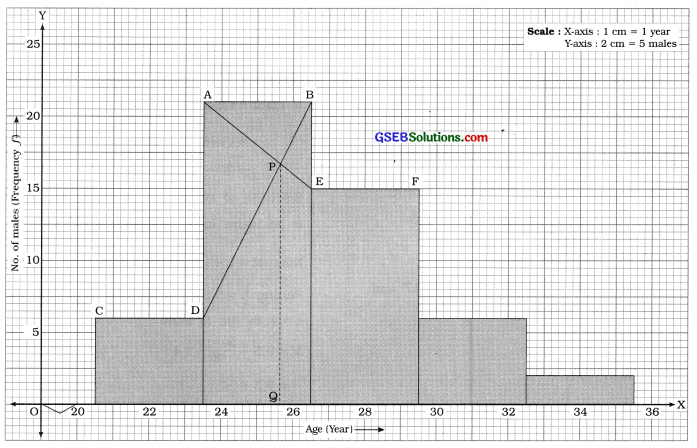
From histogram mode = OQ = 25.5 years
Hence, mode of the age at marriage = 25.5 years.