Gujarat Board Statistics Class 11 GSEB Solutions Chapter 3 Measures of Central Tendency Ex 3.4 Textbook Exercise Questions and Answers.
Gujarat Board Textbook Solutions Class 11 Statistics Chapter 3 Measures of Central Tendency Ex 3.4
Question 1.
Find all quartiles for the data given below about marks scored by 15 students in class test.
8, 8, 7, 0, 2, 4, 6, 5, 5, 4, 8, 9, 3, 6, 7
Answer:
Arranging the observations on marks in ascending order.
0, 2, 3, 4, 4, 5, 5, 6, 6, 6, 7, 7, 8, 8, 9 Here, n = 15
First Quartile :
Q1 = Value of \(\left(\frac{n+1}{4}\right)\)th observation
= Value of \(\left(\frac{15+1}{4}\right)=\left(\frac{16}{4}\right)\) = 4th observation
= 4 Marks
Hence, first quartile = 4 marks.
Second Quartile:
Q2 = Value of 2\(\left(\frac{n+1}{4}\right)\)th observation
= Value of 2 (4)
= 8th observation = 6 marks
Hence, second quartile = 6 marks.
Third Quartile:
Q3 = Value of 3\(\left(\frac{n+1}{4}\right)\)th observation
= Value of 3 (4) = 12th observation = 7 marks
Hence, third quartile = 7 marks.
![]()
Question 2.
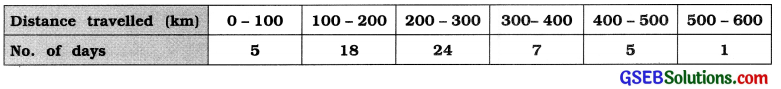
The following table shows data about the distance travelled (in km) by a salesman on different days. Find median, Q3, D8, P62 and interpret them
Answer:
We obtain the cumulative frequency distribution for the given frequency distribution.
| Distance travelled (km) | No. of days f | Cumulative frequency cf |
| 0-100 | 5 | 5 |
| 100-200 | 18 | 23 |
| 200 – 300 | 24 | 47 |
| 300 – 400 | 7 | 54 |
| 400 – 500 | 5 | 59 |
| 500 – 600 | 1 | 60 |
| Total | n = 60 | – |
Median:
M class = Class that Includes (\(\frac{n}{2}\)) th observation
= Class that includes (\(\frac{60}{2}\))
= Class that includes 30th observation
Referring to column cf M class = 200 – 300.
Now. M = L + \(\frac{\left(\frac{n}{2}\right)-c f}{f}\) × c
Putting L = 200. = 30, cf = 23, f = 24 and c = 100 in the formula.
M = 200 + \(\frac{30-23}{24}\) 100
= 200 + \(\frac{7 \times 100}{24}\)
= 200 + \(\frac{700}{24}\)
= 200 + 29.17 = 229.17 km
Hence, median M = 229.17 km
Interpretation: M = 229.17 km. Hence, travelling of 50 % of days will be less than or equal to 229.17km.
Third Quartile:
Q3 class = Class that includes 3\(\left(\frac{n}{4}\right)\)th observation
= Class that includes 3\(\left(\frac{60}{4}\right)\)
= 45th observation
Referring to column cf, Q3 class = 200 – 300.
Now. Q3 = L + \(\frac{3\left(\frac{n}{4}\right)-c f}{f}\) × c
Putting L = 200, 3\(\left(\frac{n}{4}\right)\) = 45. cf = 23 f = 24 and c = 100 In the formula.
Q3 = 200 + \(\frac{45-23}{24}\)
= 200 + \(\frac{22}{24}\) × 100
= 200 + \(\frac{2200}{24}\)
= 200 + 91.67
= 291.67km.
Hence, third quartile Q3 = 291.67 km.
Interpretation : Q3 = 291.97 km.
Hence, the maximum travelling in 75 % of days will be 291.97 km.
Eighth Decile:
D8 Class = Class that includes 8\(\left(\frac{n}{10}\right)\)th observation
= Class that includes 8\(\left(\frac{n}{10}\right)\)
= Class taht includes 48th observation
Referring to column cf. D8 class = 300 – 400.
Now. D8 = L + \(\frac{8\left(\frac{n}{10}\right)-c f}{f}\) × c
Putting L = 300, 8 \(\left(\frac{n}{10}\right)\) = 48, cf = 47. f = 7
and c = 100 In the formula,
D8 = 300 + \(\frac{48-47}{7}\) × 100
= 300 + \(\frac{1 \times 100}{7}\)
= 300 + 14.29
= 314.29 km
Hence, eighth decile D8 = 314.29 km.
Interpretation: D8 = 314.29 km. Hence, travelling in 80 % of days will be less than or equal to 314.29 km means maximum travelling will be 314.29 km.
Sixty-two th Percentile:
P62 class = class that includes 62 \(\left(\frac{n}{100}\right)\) observation
= class that includes 62 \(\left(\frac{60}{100}\right)\)
= class that includes 62 × 0.60 = 37.2th observation
Referring to column cf, P62 class = 200 – 300.
Now, P62 = L + \(\frac{62\left(\frac{n}{100}\right)-c f}{f}\) × c
Putting L = 200, 62\(\left(\frac{n}{100}\right)\) = 37.2 cf = 23 f = 24, c = 100 in the formula,
P62 = 200 + \(\frac{37.2-23}{24}\) × 100
= 200 + \(\frac{14.2 \times 100}{24}\)
= 200 + \(\frac{1420}{24}\)
= 200 + 59.17
= 259.17 km
Hence, sixty-twoth percentile P62 = 259.17 km.
Interpretation: P62 = 259.17 km. Hence, travelling in 62 % days will be less than or equal to 259.17 km means the maximum travelling will be 259.17 km.
![]()
Question 3.
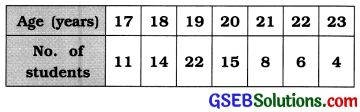
The following table gives ages of 80 students selected from a college:
Answer:
| Age (in years) | No. of students f | Cumulative frequency cf |
| 17 | 11 | 11 |
| 18 | 14 | 25 |
| 19 | 22 | 47 |
| . 20 | 15 | 62 |
| 21 | , 8 | 70 |
| 22 | 6 | 76 |
| 23 | 4 | 80 |
| Total | n = 80 | – |
Median:
M = Value of \(\)th observation
= Value of \(\)
= Value of 40.5th observation
Referring to column cf M = 19 year
Interpretation: M = 19 year. Hence, the age of 50% of students will be 19 year or less, i.e., maximum age of the age will be 19 year.
First Quartile:
Q1 = Value of \(\left(\frac{n+1}{4}\right)\)th observation
= Value of \(\left(\frac{80+1}{4}\right)=\left(\frac{81}{4}\right)\)
= Value of 20.25 the observation
Referring to column cf, Q1 = 18 year
Interpretation: Q1 = 18 year. Hence, the age of 25 % of students will be 18 year of less than it.
Fourth Decile:
D4 = Value of 4\(\left(\frac{n+1}{10}\right)\)th observation
= Value of 4\(\left(\frac{80+1}{10}\right)\) = 4(8.1)
= Value of 32.4th observation Referring to column cf, D4 = 19 year
Interpretation : D4 = 19 year. Hence, the age of 40 % of students will be 19 year or less than it.
Thirty-two nd Percentile :
P32 = Value of 32 \(\left(\frac{n+1}{100}\right)\)th observation
= Value of 32\(\left(\frac{80+1}{100}\right)\)
= Value of 32 × 0.81 = 25.92th observation
Referring to column cf,
P32 = Value of 25th observation + 0.92 (Value of 26th observation – Value of 25th observation)
= 18 + 0.92 (19 – 18)
= 18 + 0.92
∴ P32 = 18.92 year
Interpretation : P32 = 18.92 year. Hence, the age of 32 % of students will be 18.92 year or less than it.
Question 4.
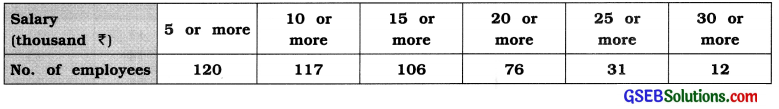
Use the following data to find the median salary of employees in a firm. Also find the lower limit for the richest 20% employees.
Answer:
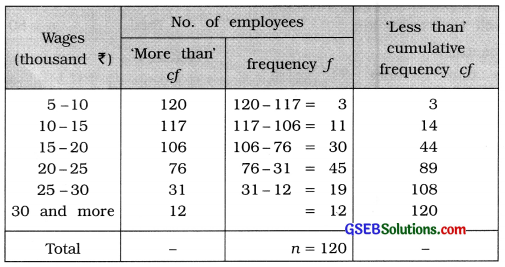
Here, ‘more than’ type cumulative frequency distribution is given. The difference between two successive lower boundary points is 5. Therefore, class length c = 5.
We obtain the original frequency distribution and ‘less than’ type cumulative frequencies as follows :
20 % of employees are richest employees, i.e..
80 % employees are getting wages than less than P.
P80 class = Class that Includes 80\(\left(\frac{n}{100}\right)\)th observation
= Class that includes 80\(\left(\frac{120}{100}\right)\)
= Class that Includes 80 (1.2)
= 96th observation
Referring to column cf. P80 class = 25 – 30
Now. P80 = L + \(\frac{80\left(\frac{n}{100}\right)-c f}{f}\) × c
Putting L=25. 80\(\left(\frac{n}{100}\right)\) = 96. cf = 89, f = 19 and c = 5 In the formula.
P80 = 25 + \(\frac{96-89}{19}\) × 5
= 25 + \(\frac{7 \times 5}{19}\)
= 25 + \(\frac{35}{19}\) = 25 + 1.84 = ₹ 26.84 thousand
Hence, the lowest limit of 20 % of employees getting maximum wage will be ₹ 26.84 thousand.
Median:
M class = Class that includes \(\left(\frac{n}{2}\right)\)th observation
= Class that includes \(\left(\frac{120}{2}\right)\)
= Class that includes 60 th observation
Referring to column cf,
M class = 20 – 25
Now, M = L + \(\frac{\left(\frac{n}{2}\right)-c f}{f}\) × c
Putting L = 20, \(\left(\frac{n}{2}\right)\) = 60, cf = 44, f = 45 and c = 5 in the formula,
M = 20 + \(\frac{60-44}{45}\) × 5
= 20 + \(\frac{16 \times 5}{45}\)
= 20 + \(\frac{80}{45}\)
= 20 + 1.78
= ₹ 21.78 (thousand)
Hence, Median = ₹ 21.78 thousand
![]()
Question 5.
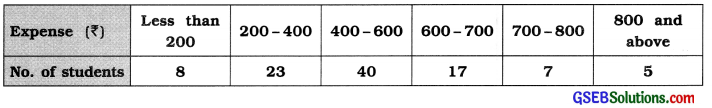
The following table shows the monthly expense for entertainment in a group of 100 students. Find the median of this expense.
Answer:
We obtain the cumulative frequency distribution for the given frequency distribution :
| Expense (in ₹) | No. of students f | Cumulative frequency cf |
| Less than 200 | 8 | 8 |
| 200-400 | 23 | 3131 31 |
| 400-600 | 40 | 71 |
| 600-700 | 17 | 88 |
| 700-800 | 7 | 95 |
| 800 and more | 5 | 100 |
| Total | n = 100 | – |
Median:
M class = Class that includes \(\left(\frac{n}{2}\right)\)th observation
= Class that includes \(\left(\frac{100}{2}\right)\)
= Class that Includes 50th observatIon
Referring to column cf. M class = 400 – 600
Now. M = L + \(\frac{\left(\frac{n}{2}\right)-c f}{f}\) × c
Putting L = 400, \(\left(\frac{n}{2}\right)\) = 50. cf = 31. f= 40 and
c = 200 in the formula.
M = 400 + \(\frac{50-31}{40}\) × 200
400 + (19 × 5) = 400 + 95 = ₹ 495
Hence. Median M = ₹ 495
Question 6.
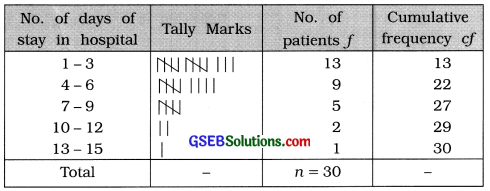
The following data indicate records of hospital stays (in days) of 30 patients admitted to a hospital:
![]()
Find the median of stay. Further convert this information in a continuous frequency distribution (inclusive type) by taking classes of equal length starting from 1 – 3. Find the median from the frequency distribution and compare it with your earlier answer.
Answer:
Median of unclassified data:
Arranging the observations on number of days stayed in hospital in ascending order.
![]()
Here, n = 30
∴ Median M = Value of \(\left(\frac{n+1}{2}\right)\)
= Value of \(\left(\frac{30+1}{2}\right)\)
= 15.5th observation
= \(\frac{\text { value of } 15 \text { th observation }+\text { value of } 16 \text { th observation }}{2}=\frac{4+4}{2}\) = 4
Hence, Median of unclassified data median M = 4 days
Median of classified data:
Minimum observation = 1 and maximum observation = 15
Initial class 1 – 3 is given. We have to prepare the inclusive frequency distribution of equal class length. Therefore the next second class will be 4 – 6 and the last class that includes the maximum observation 15, will be 13-15. The inclusive continuous frequency distribution is obtained as follows:
Median :
M class = Class that includes \(\left(\frac{n}{2}\right)\)th observation
= Class that includes \(\left(\frac{30}{2}\right)\)
= 15 th observation
Referring to column cf, M class = 4 – 6
In exclusive form, M class = 3.5 – 6.5
Now, M = L + \(\frac{\left(\frac{n}{2}\right)-C f}{f}\) × c
Putting L = 3.5, \(\left(\frac{n}{2}\right)\) = 15, cf = 13, f = 9 and c = 3 in the formula,
M = 3.5 + \(\frac{15-13}{9}\) × 3
= 3.5 + \(\frac{2}{3}\)
= 3.5 + 0.67
= 4.17
Hence, median of classified data = 4.17 days
≈ 4 days
The median of unclassified data = 4 days
Thus, in both the cases the value of median is approximately equal.