Gujarat Board Statistics Class 11 GSEB Solutions Chapter 3 Measures of Central Tendency Ex 3.5 Textbook Exercise Questions and Answers.
Gujarat Board Textbook Solutions Class 11 Statistics Chapter 3 Measures of Central Tendency Ex 3.5
Question 1.
The IQ levels of students in a class are given below. Find the modal value of IQ level of students.
146, 134, 143, 144, 138, 145, 153, 138, 138, 146, 140, 135
Answer:
In the given data, observation 138 repeats thrice which is the highest than the repetition of any other observation of data.
Hence, the mode of intelligence quotent of student M0 = 138
![]()
Question 2.
The following table gives the number of cakes sold each day at a bakery. Find the mode for sale of cakes.

Answer:
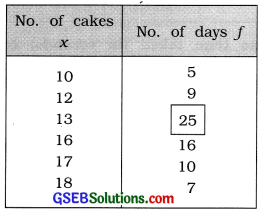
Mode of sale of cakes:
For the given frequency distribution,
The observation having maximum frequency 25 = 13 cakes
Hence, the mode of sale of cakes M0 = 13 cakes
Question 3.
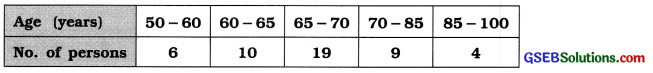
The distribution of ages of 48 persons in an old age home is given below. Which formula will be appropriate to find the mode? Why? Find the modal age of the persons in the old age home using the formula you have chosen.
Answer:
The given frequency distribution is of unequal class length. Therefore, empirical formula M0 = 3M – 2x is an appropriate formula to find mode. We calculate x and M for the given data.
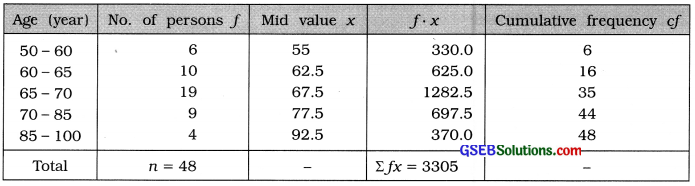
Mean:
x̄ = \(\frac{\Sigma f x}{n}=\frac{3305}{48}\) = 68.85 years
Median:
M class = class that Includes \(\left(\frac{n}{2}\right)\)the observation = class that Includes \(\left(\frac{48}{2}\right)\) = 24th observation
Referring to column cf, M class = 65 – 70
Now, M = L +\(\frac{\left(\frac{n}{2}\right)-c f}{f}\) × c
Putting L = 65, \(\left(\frac{n}{2}\right)\) = 24, cf = 16, f = 19 and c = 5 in the formula,
M = 65 + \(\frac{24-16}{19}\) × 5 = 65 + \(\frac{8 \times 5}{19}\) = 65 + \(\frac{40}{19}\) = 65 + 2.11= 67.11 year
Hence, Median = 67.11 year
Mode:
M0 = 3M – 2x̄
Putting M = 67.11 and x̄ = 68.85 in the formula,
M0 = 3 (67.11) – 2 (68.85)
= 201.33 – 137.7 = 63.63 year
Hence, the mode of age of persons of an old age house M0 = 63.63 year
Question 4.
Comment on the mode for the following data showing the time taken (in seconds) for 8 competitors in a running race:
25.2, 26.5, 28.6, 32.1, 29.0, 29.3, 31.3, 27.8
Answer:
Time taken (in seconds) by 8 competitors in a running competition is as follows :
25.2, 26.5, 28.6, 32.1, 29.0, 29.3, 31.3, 27.8
Here, each observation occurs only once. Therefore by definition of mode, it cannot be found for the given data. But it may be obtained by using the empirical formula of mode.
Question 5.
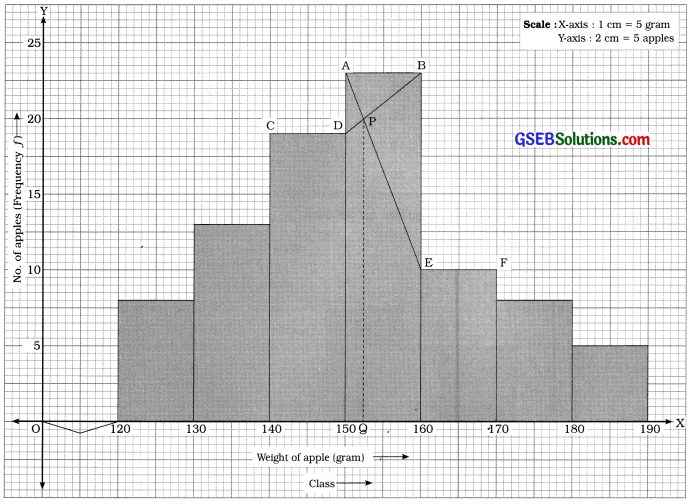
The table below shows the data about weights of 86 apples from a garden. Find the mode for the weight of apples:
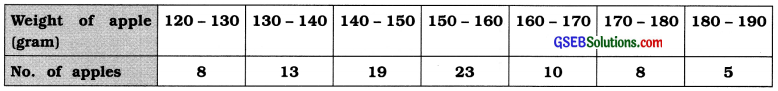
Also find the mode of this distribution graphically.
Answer:
| Weight of apple (gram) | No. of apples |
| 120-130 | 8 |
| 130-140 | 13 |
| 140-150 | 19 = f1 |
| 150-160 | 23 = fm |
| 160-170 | 10 = f2 |
| 170-180 | 8 |
| 180-190 | 5 |
Mode by formula:
Here, maximum frequency = 23
∴ Mode M0 class = 150 – 160
Now, M0 = L + \(\frac{f_{m}-f_{1}}{2 f_{m}-f_{1}-f_{2}}\) × c
Putting L = 150, fm = 23, f1 = 19, f2 = 10 and c = 10 in the formula,
M0 = 150 + \(\frac{23-19}{2(23)-19-10}\) × c
= 150 + \(\frac{4 \times 10}{46-29}\)
= 150 + \(\frac{40}{17}\)
= 150 + 2.35
= 152.35 gram.
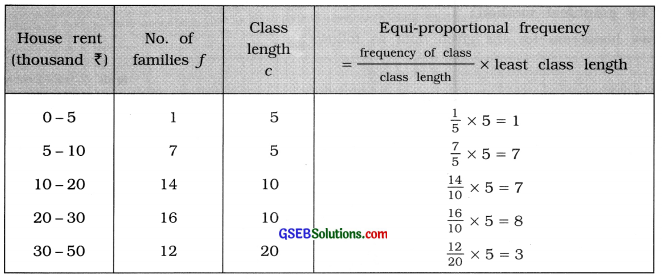
From the above data we draw histogram as follows :
From graph mode = OQ = 22. Hence, mode of house rent = ₹ 22 thousand.
Mode by graphical method:
We draw histogram for the given data as follows :
![]()
Question 6.
The data about the monthly house rent paid by 50 families is given in the following table:

Find the mode for house rent using the graphical method.
Answer:
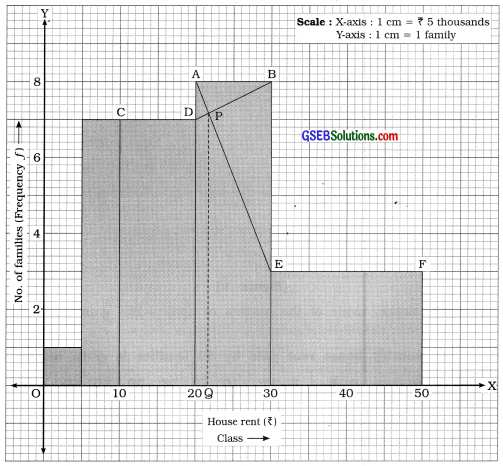
In the given frequency distribution class length is not equal. Therefore to draw histogram we obtain the equi-proportional frequency of each class in relation to the least class length of the given frequency distribution. Least class length = 5