Gujarat Board Statistics Class 11 GSEB Solutions Chapter 4 Measures of Dispersion Ex 4 Textbook Exercise Questions and Answers.
Gujarat Board Textbook Solutions Class 11 Statistics Chapter 4 Measures of Dispersion Ex 4
Section – A
Choose the correct option from those given below each question:
Question 1.
From the following, which is the formula for coefficient of range?
(a) xH – xL
(b) \(\frac{x_{\mathrm{H}} – x_{\mathrm{L}}}{x_{\mathrm{H}} + x_{\mathrm{L}}}\)
(c) \(\frac{x_{\mathrm{H}} + x_{\mathrm{L}}}{x_{\mathrm{H}} – x_{\mathrm{L}}}\)
(d) xH – xL
Answer:
(b) \(\frac{x_{\mathrm{H}}-x_{\mathrm{L}}}{x_{\mathrm{H}}+x_{\mathrm{L}}}\)
Question 2.
In which measure of dispersion, the absolute difference of the observation and its mean is considered?
(a) Mean Deviation
(b) Standard Deviation
(c) Range
(d) Quartile Deviation
Answer:
(a) Mean Deviation
Question 3.
Which of the following measures is a unit-free measure?
(a) Mean Deviation
(b) Quartile Deviation
(c) Range
(d) Coefficient of Variation
Answer:
(d) Coefficient of Variation
Question 4.
Which measure of dispersion is least affected by the extreme values of the observations?
(a) Range
(b) Standard Deviation
(c) Quartile Deviation
(d) Mean Deviation
Answer:
(c) Quartile Deviation
Question 5.
The coefficient of variation of group A is less than the coefficient of variation of group B. Which group is more consistent with respect to variability?
(a) A
(b) B
(c) Both
(d) None of these
Answer:
(a) A
Question 6.
The weight (in kg) for 10 students are 53, 47, 60, 55, 71, 65, 61, 68, 63, 70. What is the range of the data?
(a) 17 kg
(b) 23 kg
(c) 24kg
(d) 18kg
Answer:
(c) 24kg
Question 7.
If the first quartile and the third quartile of a data are 30 and 50 respectively then what is the value of coefficient of quartile deviation?
(a) 0.25
(b) 50
(c) 4
(d) 20
Answer:
(a) 0.25
![]()
Question 8.
What is the value of any measure of dispersion for the observations 5, 5, 5, 5, 5?
(a) 1
(b) 5
(c) 0
(d) 25
Answer:
(c) 0
Question 9.
If mean of a variable is 10 and the coefficient of variation is 60 %. What is the variance of the variable?
(a) 6
(b) 36
(c) 60
(d) 50
Answer:
(b) 36
Question 10.
Suppose the standard deviation of the series k1, k2, k3, …, kn is 5. What will be the standard deviation of the following series?
(i) k1 + 2, k2 + 2, k3 + 2, kn + 2
(ii) 3k1, 3k2, 3k3, …, 3kn
(a) (i) 7 (ii) 3
(b) (i) 5 (ii) 3
(c) (i) 5 (ii) 15
(d) (i) 7 (ii) 15
Answer:
(c) (i) 5 (ii) 15
Question 11.
The mean and standard deviation for a variable x are 5 and 2 respectively. Now, if y = 3x + 4 then what are the mean and the standard deviation of y?
(a) 19 and 6
(b) 15 and 49
(c) 19 and 10
(d) 15 and 10
Answer:
(a) 19 and 6
Question 12.
The mean and standard deviation of a set of observations are 45 and 5 respectively. If a constant 5 is added to each observation, what is the coefficient of variation of the new set of the observations?
(a) 10 %
(b) 50 %
(c) 11.11 %
(d) 900 %
Answer:
(a) 10 %
Section – B
Answer the following question in one sentence:
Question 1.
Define the range.
Answer:
The difference between the highest and lowest observation of the data is called the range and it is denoted by the symbol R., i.e., R = xH – xL
![]()
Question 2.
Define the quartile deviation.
Answer:
The measure obtained by dividing the difference between the third quartile Q3 and Q1 the first quartile of the data by 2 is called quartile deviation and it is denoted by Qd, i.e., Qd = \(\frac{Q_{3}-Q_{1}}{2}\)
Question 3.
Which types of measures of dispersion are used for comparing two or more groups in terms of the variability?
Answer:
The relative measures of dispersion are used for comparing two or more groups in terms of the variability.
Question 4.
Which is the best measure of dispersion?
Answer:
Standard deviation is the best measure of dispersion.
Question 5.
If the data of heights of 10 students are given in centimeter, what is the unit of its variance?
Answer:
If the data of heights of 10 students are given in centimeter, the unit of its variance is (Centimeter)2.
Question 6.
For a company making pipes, the following information of diameter (in cm) of pipes is obtained. Find the range of the diameter of the pipes.
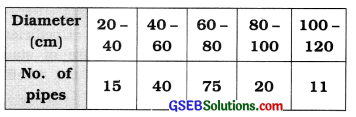
Answer:
Here,
xH = Upper limit of last class 100 – 120 = 120
xL = Lower limit of initial class 20 – 40 = 20
∴ Range R = xH – xL
= 120 – 20 = 100 cm
Question 7.
The 25th and 75th percentiles of a frequency distribution are 72.18 and 103.99 respectively. Find the quartile deviation.
Answer:
25th percentile = Q1 = 72.18.
75th percentile = Q3 = 103.99 .
Quartile deviation Qd = \(\frac{Q_{3}-Q_{1}}{2}\)
= \(\frac{103.99-72.18}{2}\)
= \(\frac{31.81}{2}\) = 15.905 ≈ 15.91
Question 8.
Seven students of a group get 20, 20, 20, 20, 20, 20, 20 marks in a test of 25 marks. What is the standard deviation of their marks?
Answer:
Observations of marks are 20, 20, 20, 20, 20, 20, 20.
All the observations are of same magnitude. Hence, standard deviation marks s will be zero, i.e., s = 0.
Question 9.
Find the mean deviation for the observations – 1, 0, 4.
Answer:
Observations x: – 1, 0, 4
∴ Mean x̄ = \(\frac{-1+0+4}{3}=\frac{3}{3}\) = 1
Now, Σ|x – x̄| = 2 + 1 + 3 = 6
∴ Mean deviation MD = \(\frac{\sum|x-\bar{x}|}{n}=\frac{6}{3}\) = 2
Section – C
Answer the following questions as required:
Question 1.
Define the following:
(i) Mean Deviation
Answer:
Mean Deviation: The mean of the absolute deviations of a data from its mean is called mean deviation and it is denoted by MD.
(ii) Standard Deviation
Answer:
Standard Deviation: Standard deviation is the positive square root of the mean of the squares of the deviations measured from the mean. It is denoted by ‘s’.
(iii) Coefficient of Variation
Answer:
Coefficient of Variation: Coefficient of Variation is the percentage measure of standard deviation in relation to the mean., i.e., Coefficient
of Variation = \(\frac{s}{\bar{x}}\) × 100.
![]()
Question 2.
What is meant by the absolute and relative measures of dispersion?
Answer:
The Absolute Measure of DispersIon : A measure of dispersion expressed In the same units in which the observations of the data are expressed Is called an absolute measure of dispersion. If the unit of the observations of the data is cm. the absolute measure of dispersion Is expressed In cm. it cannot be used for comparing the dispersion of two or more groups with different units.
The Relative Measure of Dispersion : A measure of dispersion which Is free from the unit of measurement Is called the relative measure of dispersion. The variability of two or more sets of data having different unit of measurement can be compared by relative measure of dispersion. It Is the ratio of the absolute measure of dispersion and the measure of average. i.e..
Relative measure of dispersion = \(\frac{\text { absolute measure of dispersion }}{\text { average }}\)
Question 3.
Write names of the absolute measures of dispersion.
Answer:
The absolute measures of dispersion are :
- Range
- Quartile deviation.
- Mean deviation and
- Standard deviation.
Question 4.
Which measures of dispersion are based on the deviations of observation from their mean?
Answer:
Mean Deviation and standard deviation are the measures of dispersion based on the deviations of deviations from their mean.
Question 5.
Find the range and the coefficient of range for the observation 6, 11, -3, 0, 8.
Answer:
Observations x: 6, 11, -3, 0, 8
Here, xH = 11; xL = – 3
Range:
Range R = xH – xL
= 11 – (-3) = 11 + 3 = 14
Coefficient of range:
Coefficient of range = \(\frac{\mathrm{R}}{x_{\mathrm{H}}+x_{\mathrm{L}}}\)
= \(\frac{14}{11-3}=\frac{14}{8}\) = 1.75
Question 6.
Find the coefficient of quartile deviation for the observations:
8, 15, 2, 11, 20, 3, 5
Answer:
Writing observallons In ascending order
2. 3. 5. 8. 11, 15. 20
Here. n = 7
First quartile:
Q1 = Value of \(\left(\frac{n+1}{4}\right)\)th observation
= Value of \(\left(\frac{7+1}{4}\right)\)
= 2nd observatIon
= 3
Third quartile:
Q3 = Value of 3\(\left(\frac{n+1}{4}\right)\) th observation
= Value of 3 (2) = 6th observatIon
= 15
Coefficient of quartile deviation:
Coefficient of Qd = \(\frac{Q_{3}-Q_{1}}{Q_{3}+Q_{1}}=\frac{15-3}{15+3}\)
= \(\frac{12}{18}=\frac{2}{3}\) = 0.67
Question 7.
Find the mean deviation for the observations: 3, 8, 1, 7, 6
Answer:
Here, n = 5
x: 3, 8, 1, 7, 6
∴ Mean x̄ = \(\frac{3+8+1+7+6}{5}=\frac{25}{5}\) = 5
Σ|x – x̄| = 2 + 3 + 4 + 2 + 1 = 12
Mean deviation MD = \(\frac{\Sigma|x-\bar{x}|}{n}\)
= \(\frac{12}{4}\) = 2.4
Question 8.
If x = 25 and the coefficient of variation is 20 %, find the variance.
Answer:
x̄ = 25, coefficient of variation = 20 %, variance s2 =?
Coefficient of variation = \(\frac{s}{\bar{x}}\) × 100
∴ 20 = \(\frac{s}{25}\) × 100
∴ 20 = 4s
∴ s = \(\frac{2}{4}\) = 5
Hence, variance = s2 = (5)2 = 25
![]()
Question 9.
Find the standard deviation for observations 1, 2, 3, 4, 5.
Answer:
Here, n = 5
x: 1, 2, 3, 4, 5
(x – x̄): – 2, -1, 0,1, 2 ∴Σ(x – x̄) = 0
(x – x̄)2: 4, 1, 0, 1, 4 ∴Σ (x – x̄)2 = 10
Standard deviation:
s = \(\sqrt{\frac{\Sigma(x-\bar{x})^{2}}{n}}=\sqrt{\frac{10}{5}}=\sqrt{2}\) = 1.41
Question 10.
Which of the following factories is more stable with respect to daily production?
| Factory A | Factory B | |
| Average Daily Production (units) | 50 | 48 |
| Standard deviation (units) | 10 | 12 |
Answer:
We will determine the stability of factory in context to daily production by comparing the coefficient of variation of daily production of Factory A and Factory B.
Factory A:
x̄ = Average daily production = 50
s = Standard deviation =10
Coefficient of variation = \(\frac{s}{\bar{x}}\) × 100
= \(\frac{10}{50}\) × 100 = 20 %
Factory B:
x̄ = Average daily production = 48
s = Standard deviation = 12
Coefficient of variation = \(\frac{s}{\bar{x}}\) × 100
= \(\frac{12}{48}\) × 100 = 25 %
The coefficient.of variation of daily production of factory A is less than that of factory B. Hence, the- daily production of factory A is more stable.
Question 11.
The 25th and the 75th percentiles of a data set are 20 and 36 respectively. Find the coefficient of quartile deviation of the data set.
Answer:
Here, P25 = 20 ∴ Q1 = 20 (∵P25 = Q1)
P75 = 36 ∴ Q3 = 36 (∵ P75 = Q3)
Coefficient of quartile deviation:
Coefficient of Qd = \(\frac{Q_{3}-Q_{1}}{Q_{3}+Q_{1}}=\frac{36-20}{36+20}=\frac{16}{56}\) = 0.29
Section – D
Answer the following questions as required:
Question 1.
Explain the meaning of dispersion and state different measures of dispersion.
Answer:
The measure of average is a measure which is either representative or summary or essence of observations of the data. But all the observations are not equal to the value of measure of average. Infact some values of observations are close to the value of measure of average and some values of observations are far from value of the measure. Moreover, the variations among the individual observation of the data are also different. Hence, it is essential to obtain a measure which supplements the measures of averages by measures of variability among the individual observations of the data and gives idea about the extent and nature of variations and the clustering of the observations from a measures of average.
Such a measure is called dispersion. Thus, the measure, showing how the observations of the data are scattered from the measures of average is called dispersion. The measure based on it is called the measure of dispersion. Study the following example to understand its meaning clearly.
Suppose that two students A and B have secured the below-mentioned marks in the five tests of 20 marks each:
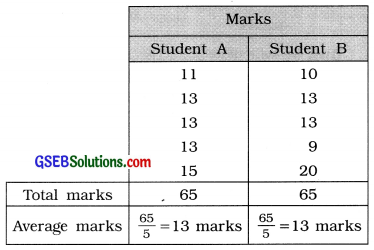
Here, it is clear that the average marks of both the students are equal and that is 13. Although the range of variation for student A’s marks is 15-11 =4 marks, while the range of variation for student B’s marks is 20 – 9 = 11 marks. Moreover, the observations of student As marks are close to the average marks 13, while the observations of student B’s marks are comparatively away from the average marks 13. Thus, the conclusion that both the students are equally efficient, based on the measure of average only is erroneous and misleading. Hence, it is essential to have some information on the deviation of observations of marks of student from the average marks. This information can be obtained by dispersion.
Different measures of dispersion: The different measures of dispersion are
- Range
- Quartile Deviation
- Mean Deviation and
- Standard Deviation.
![]()
Question 2.
State the desirable characteristics of dispersion.
Answer:
The desirable characteristics of dispersion are as follows:
- The definition of a measure of dispersion should be clear and precise.
- It should be simple to understand and easy to compute.
- It should be based on all observations of the data.
- It should be least affected by sampling i.e., it should be stable measure.
- It should be suitable for further algebric and statistical calculation.
- It should be least affected by extreme observations of the data.
Question 3.
Write advantages and disadvantages of the range.
Answer:
Advantages of Range:
- Range is clearly defined.
- It is easy to understand and simple to compute.
- It is a useful measure especially when variability among the observations of the data is less.
Disadvantage of Range:
- All the observations are not used in computing range.
- It is more affected by sampling.
- It is not a suitable measure for algebric operations.
- It cannot be obtained for open-ended frequency distribution.
Question 4.
Write advantages and disadvantages of the quartile deviation.
Answer:
Advantages of Quartile Deviation:
- It’s definition is clear and it is easy to compute.
- Extreme observations do not affect its value.
- Quartile deviation can also be computed for the open-ended frequency distribution.
Disadvantages of Quartile Deviation:
- All the observations of the data are not used in its computation.
- It is not a suitable measure for other algebraic manipulations.
- It is widely affected by the fluctuations of sampling.
- This measure is less used for higher study in Statistics.
Question 5.
Write advantages and disadvantages of the mean deviation.
Answer:
Advantages of Mean Deviation:
- Its definition is clear.
- All the observations are used in its computation.
- Its value is less affected by the extreme observations as compared to other measures of dispersion.
- The total variations of the observations from their mean is considered in its computation.
- It is a better measure than range and Quartile deviation.
- It is useful as a measure of dispersion for the study of social sciences.
Disadvantages of Mean Deviation:
- Its computation is difficult as compared to the computation of range and Quartile deviation.
- It is not a suitable measure for other algebraic manipulations.
- It is less useful measure for the higher study of Statistics because of its dependence on the absolute value of deviation from the mean.
- It cannot be computed for open-ended frequency distribution.
Question 6.
Write advantages and disadvantages of the standard deviation.
Answer:
Advantages of Standard Deviation:
- Its definition is clear and precise.
- All observations of the data are used in its computation.
- It is a more efficient measure of dispersion among the other measures of dispersion.
- If Mean and Standard deviations are given for two data sets, combined Standard deviation of new data set can be obtained. Thus, it is a suitable measure for other algebraic manipulations.
- It is widely used as basic measure in higher study of Statistics.
Disadvantages of Standard Deviation:
- Its computation is difficult as compared to other measures of dispersion.
- Extreme observations enjoy more weightage in its computations.
- It is not easy to understand for a common man.
- It cannot be obtained for the open-ended frequency distribution.
Question 7.
What is standard deviation? Why is it considered as the best measure of dispersion?
Answer:
Standard Deviation: Standard deviation is the positive square root of the mean of the squares of deviations of observations of the data
from their mean. It is denoted by ‘s’, i.e.,
s = \(\sqrt{\frac{\Sigma(x-\bar{x})^{2}}{n}}\)
It is considered as the best measure of dispersion because it holds the below mentioned desired characteristics of an ideal measure of dispersion:
- Definition of standard deviation is clear and precise.
- All observations of data are used in its computation.
- It is a suitable measure for other algebraic manipulations.
- It is widely used in higher study of Statistics.
- It is the most efficient measure of all the measures of dispersion.
The value of Standard deviation is affected largely by the extreme observations and its computation is more difficult as compared to other measures of dispersion. Inspite, it holds most of the desired characteristics of an ideal measure and it is very useful and basic measure of dispersion in practice. Hence, it can be considered as the best measure of dispersion.
Question 8.
Write a .brief note on coefficient of variation.
Answer:
Karl pearson suggested coefficient of variation as an appropriate relative measure of standard deviation.
It is a percentage measure of standard deviation with respect to mean, i.e.,
Coefficient of variation = Coefficient of SD × 100
= \(\frac{s}{\bar{x}}\) × 100
- It is a most useful relative measure for comparing the dispersion of two or more data. Less the coefficient of variation of the data, less is the dispersion in it and called the data stable. Such data is called more consistant.
- More the coefficient of variation of the data, more is the dispersion in it and called the data less stable.
![]()
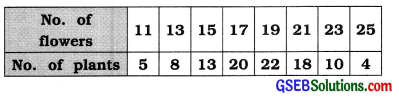
Question 9.
The information of number of flowers on 100 plants of a nursery is given below. Find the quartile deviation of the number of flowers from it.
Answer:
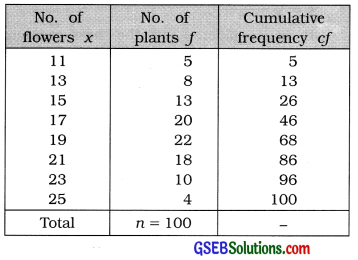
First quartile:
Q1 = Value of \(\left(\frac{n+1}{4}\right)\)th observation
= Value of \(\left(\frac{100+1}{4}\right)\)
= value of 25.25th observation
∴ Q1 = 15 flowers
Third quartile:
Q3 = Value of 3\(\left(\frac{n+1}{4}\right)\) th observation
= Value of 3 (25.25) = 6th observation
= Value of 75.75th observation
∴ Q3= 21 flowers
Coefficient of quartile deviation:
Coefficient of Qd = \(\frac{Q_{3}-Q_{1}}{2}\)
= \(\frac{21-15}{2}=\frac{6}{2}\) = 3
∴ Qd = 3 flowers
Question 10.
The information of number of goals in 16 matches of hockey tournament is given. Find the mean deviation of number of goals for it.
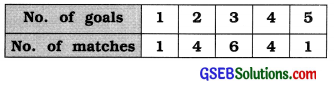
Answer:
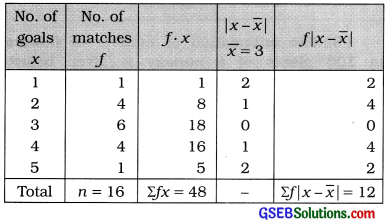
Mean:
x̄ = \(\frac{\Sigma f x}{n}=\frac{48}{16}\) = 3 Goals
Mean deviation of number of goals per match:
MD = \(\frac{\sum f|x-\bar{x}|}{n}\)
= \(\frac{12}{16}\) = 0.75 Goals
Question 11.
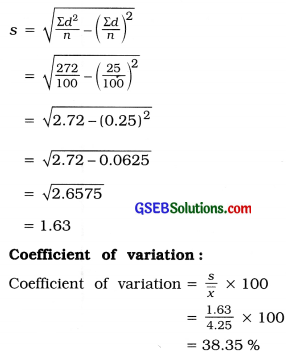
In usual notations, Σd = 25, Σd2 = 272, n = 100 and assumed mean = 4. Find the coefficient of variation.
Answer:
Here, n = 100; A = 4; Σd = 25; Σd2 = 272
Mean:
x̄ = A + \(\frac{\Sigma d}{n}\)
= 4 + \(\frac{25}{100}\)
= 4 + 0.25
= 4.25
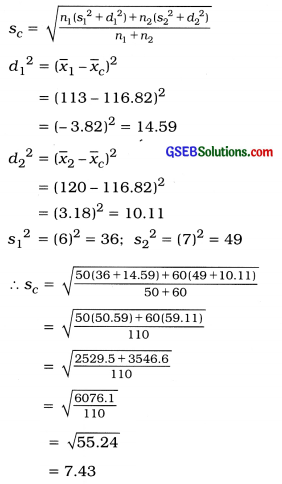
Question 12.
Find the combined standard deviation using the following Information:
| Data set A | Data set B | |
| No. of observations | 50 | 60 |
| Mean | 113 | 120 |
| Standard deviation | 6 | 7 |
Answer:
Here, n1 = 50, x̄1 = 113, s1 = 6
n2 = 60, x̄2 = 120, s2 = 7
Combined mean:
x̄c = \(\frac{n_{1} \bar{x}_{1}+n_{2} \bar{x}_{2}}{n_{1}+n_{2}}\)
= \(\frac{(50 \times 113)+(60 \times 120)}{50+60}\)
= \(\frac{5650+7200}{110}=\frac{12850}{110}\) = 116.82
Combined standard deviation:
Question 13.
The sum of 10 observations is 80 and the sum of their squares is 800. FInd the coefficient of variation of the observations.
Answer:
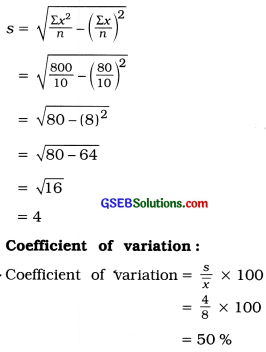
Here, n = 10, Σx = 80, Σx2 = 800
Mean:
x̄ = \(\frac{\Sigma x}{n}=\frac{80}{10}\) = 8
Standard deviation:
Section – E
Solve the following:
Question 1.
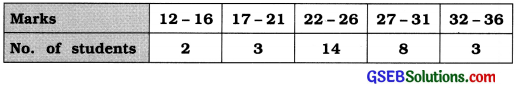
In a language spelling test of 50 marks, the frequency distribution of marks secured by 30 students is given below. Find the mean deviation of the frequency distribution.
Answer:
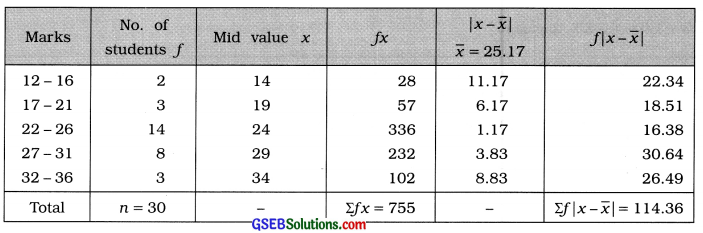
Mean:
x̄ = \(\frac{\sum f x}{n}\)
= \(\frac{755}{30}\)
= 25.166
∴ x̄ = 25.17 marks
Mean deviation:
MD = \(\frac{\Sigma f|x-\bar{x}|}{n}\)
= \(\frac{114.36}{30}\)
= 3.812
∴ MD = 3.81 marks.
![]()
Question 2.
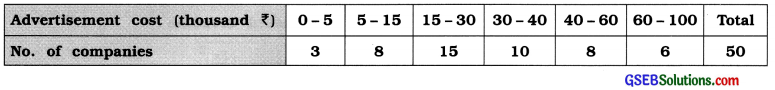
Find the quartile deviation of advertisement expenditure using following frequency distribution of advertising expenditure of 50 companies:
Answer:
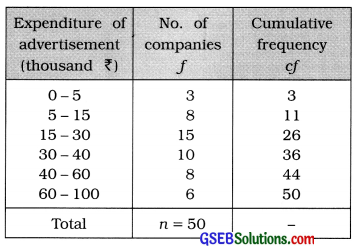
First quartile:
Q1 class = Class that Includes \(\left(\frac{n}{4}\right)\) th observation
= Class that includes \(\left(\frac{50}{4}\right)\)
= 12.5th observation
Referring to column cf Q1 class = 15 – 30
Now, Q1 = L + \(\frac{\left(\frac{n}{4}\right)-c f}{f}\) × c
Putting L = 15. \(\left(\frac{n}{4}\right)\) = 12.5, cf = 11, f = 15 and
c = 15 in the formula,
Q1 = 15 + \(\frac{12.5-11}{15}\) × 15
= 15 + 1.5 = ₹ 16.5 thousand
Third quartile:
Q3 class = Class that Includes 3\(\left(\frac{n}{4}\right)\)th observation
= Class that Includes 3 (12.5)
= 37.5 th observation
Referring to column cf, Q3 class = 40 – 60
Now, Q3 = L + \(\frac{3\left(\frac{n}{4}\right)-c f}{f}\) × c
Putting. L = 40. 3\(\left(\frac{n}{4}\right)\) = 37.5, cf = 36, f = 8 and c = 20 in the formula.
Q3 = 40 + \(\frac{37.5-36}{8}\) × 20
= 40 + \(\frac{1.5 \times 20}{8}\)
= 40 + \(\frac{30}{8}\)
= 40 + 3.75 = ₹ 43.75 thousand
Quartile deviation:
Qd = \(\frac{Q_{3}-Q_{1}}{2}\)
= \(\frac{43.75-16.5}{2}\)
= \(\frac{27.5}{2}\) = 13.625 ≈ ₹ 13.63 thousand
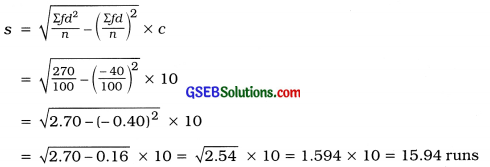
Question 3.
The information of runs scored by a batsman in his 100 matches is given below. Find the standard deviation of runs scored by him from it.
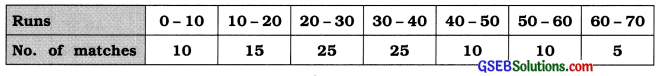
Answer:
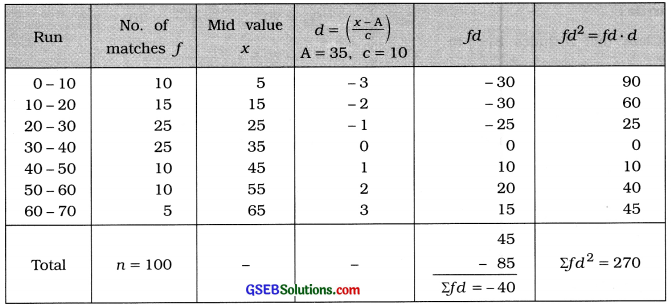
Standard deviation of runs:
Question 4.
The information of marks obtained by 220 students of a college is given below. Find the quartile deviation of the marks obtained by the students.
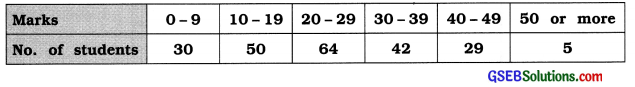
Answer:
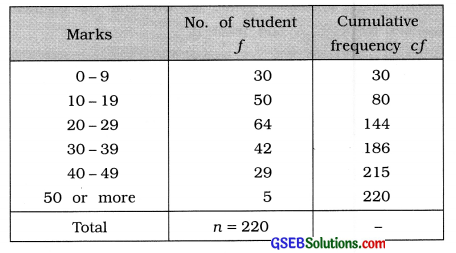
First quartile:
Q1 class = Class that Includes \(\left(\frac{n}{4}\right)\) th observation
= Class that includes \(\left(\frac{220}{4}\right)\)
= 55th observation
Referring to column cf Q1 class = 10 – 19
In exclusive form Q1 = 9.5 – 19.5
Now, Q1 = L + \(\frac{\left(\frac{n}{4}\right)-c f}{f}\) × c
Putting L = 9.5 \(\left(\frac{n}{4}\right)\) = 55, cf = 30, f = 50 and c = 10 in the formula,
Q1 = 9.5 + \(\frac{55-30}{50}\) × 10
= 9.5 + \(\frac{25}{5}\)
= 9.5 + 5 = 14.5 marks
Third quartile:
Q3 class = Class that Includes 3\(\left(\frac{n}{4}\right)\)th observation
= Class that Includes 3 (55)
= 165 th observation
Referring to column cf, Q3 class = 30 – 39
In exclusive form Q3 = 29.5 – 39.5
Now, Q3 = L + \(\frac{3\left(\frac{n}{4}\right)-c f}{f}\) × c
Putting. L = 29.5. 3\(\left(\frac{n}{4}\right)\) = 165, cf = 144, f = 42 and c = 10 in the formula.
Q3 = 29.5 + \(\frac{165-144}{42}\) × 10
= 29.5 + \(\frac{21 \times 10}{42}\)
= 29.5 + 5
= 34.5 marks
Quartile deviation:
Qd = \(\frac{Q_{3}-Q_{1}}{2}\)
= \(\frac{34.5-14.5}{2}\)
= \(\frac{20}{2}\) = 10 marks.
Question 5.
Goals scored by two teams in a football session are as follows. Which team is more consistent in its game?
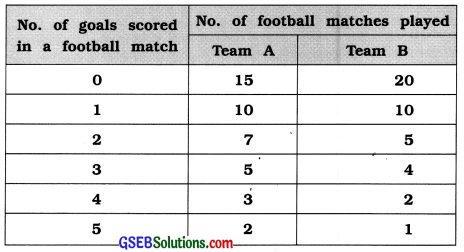
Answer:
To determine which team plays consistent game, we will find the coefficient of variation of goals scored in football matches by team A and team B.
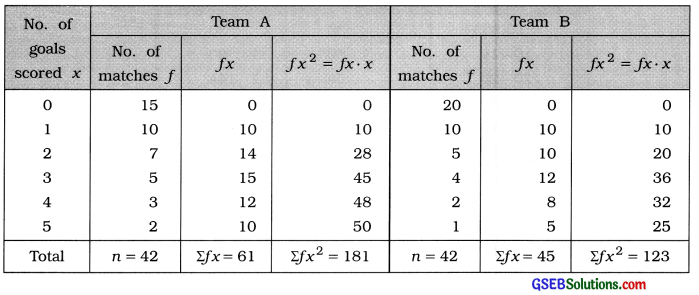
Team A
Mean:
x̄ = \(\frac{\sum f x}{n}\)
Putting Σfx = 61; n = 42. we get
x̄ = \(\frac{61}{42}\)
= 1.45 goals
Standard deviation:
S = \(\sqrt{\frac{\Sigma f x^{2}}{n}-\left(\frac{\Sigma f x}{n}\right)^{2}}\)
Putting Σfx2 = 181. Σfx = 61 and n = 42.
s = \(\sqrt{\frac{181}{42}-\left(\frac{61}{42}\right)^{2}}\)
= \(\sqrt{4.310-(1.45)^{2}}\)
= \(\sqrt{4.310-2.103}\)
= \(\sqrt{2.207}\) = 1.48 goals
Coefficient of variation:
Coefficient of variation = \(\frac{s}{\bar{x}}\) × 100
= \(\frac{1.48}{1.45}\) × 100
= 1.0207 × 100
= 102.07%
Team B
Mean:
x̄ = \(\frac{\sum f x}{n}\)
Putting Σfx = 45; n = 42, we get
x̄ = \(\frac{45}{42}\)
= 1.07 goals
Standard deviation:
S = \(\sqrt{\frac{\Sigma f x^{2}}{n}-\left(\frac{\Sigma f x}{n}\right)^{2}}\)
Putting Σfx2 = 123. Σfx = 45 and n = 42.
s = \(\sqrt{\frac{123}{42}-\left(\frac{45}{42}\right)^{2}}\)
= \(\sqrt{2.929-(1.07)^{2}}\)
= \(\sqrt{2.929-1.145}\)
= \(\sqrt{1.784}\) = 1.33 goals
Coefficient of variation:
Coefficient of variation = \(\frac{s}{\bar{x}}\) × 100
= \(\frac{1.33}{1.07}\) × 100
= 1.243 × 100
= 124.3%
The coefficient of variation of goals scored in football matches by team A is 102.07 % is less that of team B, i.e., 124.3%. Hence, the game of team A is more consistant.
![]()
Question 6.
For a sequence of 100 observations, the mean and standard deviation are 40 and 10 respectively. In calculating these measures, two observations were taken as 30 and 70 instead of 3 and 27 by mistake. Find the corrected mean and corrected standard deviation.
Answer:
Here, n = 100: x̄ = 40; s = 10
Wrong observation: 30, 70
True observations : 3, 27
Mean:
x̄ = \(\frac{\Sigma x}{n}\)
∴ 40 = \(\frac{\Sigma x}{100}\)
∴ 4000 = Σx
Corrected mean:
Corrected Σx = Σx – (Sum of wrong observation) + (Sum of true observation)
= 4000 – (30 + 70) + (3 + 27)
= 4000 – 100 + 30 = 3930
Corrected Mean = \(\frac{3930}{100}\) = 39.3
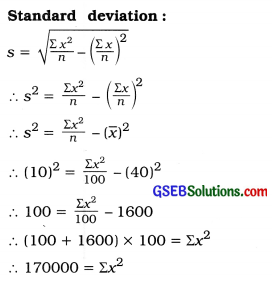
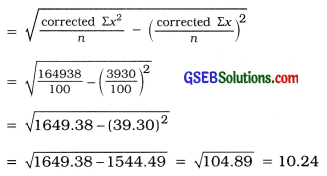
Corrected standard deviation:
Corrected Σx2 = Σx2 — (Sum of squares of wrong observation) + (Sum of squares of true observations)
= 170000 – [(30)2 + (70)2] + [(3)2 + (27)2]
= 170000 – (900 + 4900) + (9 + 729)
= 170000- 5800 + 738 = 164938
Corrected Σx = 3930 is obtained
Corrected standard deviation
Question 7.
The total cost function for a factory is y = 10 + 3x where x = No. of units produced and y = total cost of producing x units. The range, the quartile deviation, the mean deviation and standard deviation of daily production of the factory are 50, 5, 8 and 10 units respectively. Find the range quartile deviation mean deviation and standard deviation for total cost y from it.
Answer:
Here, x = No. of units of items produced y = Total production cost of x units y = 10 + 3x
For variable x: R = 50 units, Qd = 5 units, MD = 8 units, s = 10 units
Measures of dispersion are independent of change of origin but they are changed by the change of scale.
y = 10 + 3x
Range of y = 3 (Range of x) = 3 × 50 = 150 units. Quartile deviation of y = 3(Qd of x) = 3 × 5 = 15 units. Mean deviation of y = 3 (MD of x) = 3 × 8 = 24 units. Standard deviation of y = 3(S of x) = 3 × 10 = 30 units.
Section – F
Solve the following:
Question 1.
Find range, coefficient of range, quartile deviation, coefficient of quartile deviation, mean deviation and coefficient of mean deviation from the following data of number of emergency visits of 80 doctors to their patients in a town:
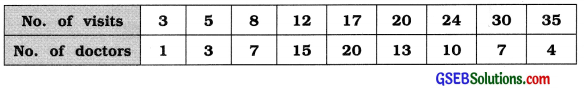
Answer:
Range:
xH = 35. xL = 3
Here, R = XH – XL
= 35 – 3 = 32 visits
First quartile:
Q1 = Value of \(\left(\frac{n+1}{4}\right)\)th observation
= Value of \(\left(\frac{80+1}{4}\right)\)th observation
= Value of 20.25 th observation
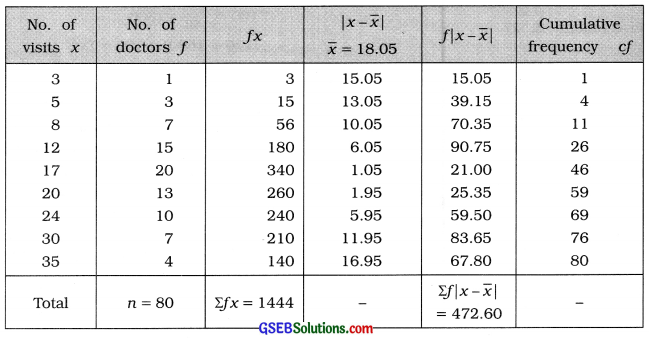
Referring to column cf Q1 = 12
Quartile deviation:
Qd = \(\frac{Q_{3}-Q_{1}}{2}\)
= \(\frac{24-12}{2}=\frac{12}{2}\) = 6 Visits
Mean:
x̄ = \(\frac{\Sigma f x}{n}=\frac{1444}{80}\) = 18.05 visits
Mean deviation:
MD = \(\frac{\sum f|x-\bar{x}|}{n}\)
\(\frac{472.60}{80}\) = 5.91 visits
Coefficient of range:
Coefficient of range = \(\frac{x_{\mathrm{H}}-x_{\mathrm{L}}}{x_{\mathrm{H}}+x_{\mathrm{L}}}\)
= \(\frac{35-3}{35+3}\)
= \(\frac{32}{38}\) = 0.84
Third quartile:
Q3 = Value of 3\(\left(\frac{n+1}{4}\right)\)th observation
= Value of 3 (20.25)th observation
= Value of 60.75th observatIon
Referring to column cf. Q3 = 24
Coefficient of Quartile deviation:
Coefficient of Qd = \(\frac{Q_{3}-Q_{1}}{Q_{3}+Q_{1}}\)
= \(\frac{24-12}{24+12}=\frac{12}{36}\) = 0.33
Coefficient of mean deviation:
Coefficient of MD = \(\frac{\mathrm{MD}}{\bar{x}}\)
= \(\frac{5.91}{18.05}\) = 0.33
Question 2.
Find the percentage of observations lying within the limits x ± s using the following distribution of credit days taken by the merchants:
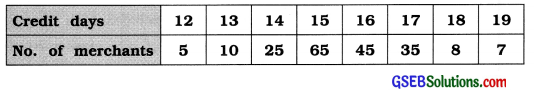
Answer:
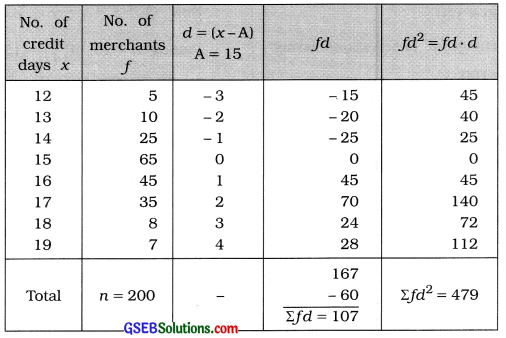
Mean:
x̄ = A + \(\frac{\Sigma f d}{n}\)
= 15 + \(\frac{107}{200}\)
= 15 + 0.535
= 15.535 days
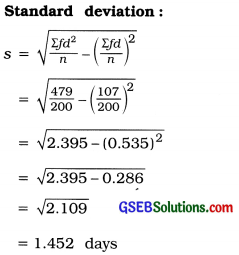
Now x̄ ± s = x̄ – s to x̄ + s
= 15.535 – 1.452 to 15.535 + 1.452
= 14.083 to 16.987
Observations x which are less than 14.083 are 14. 13. 12. The sum of their frequencies Is 5 + 10 + 25 = 40 and the observations x which are more than 16.987 are 17. 18. 19. The sum of their frequencies Is = 35 + 8 + 7 = 50. Thus. the number of observations laying out-side the Interval 14.083 to 16.987 is 40 + 50=90.
Therefore, the number of observations laying In the interval 14.083 to 16.987, i.e. x̄ ± s is = 200 – 90= 110.
Hence, the percentage of observations laying
In x̄ ±s = \(\frac{110}{200}\) × 100
= 55%
![]()
Question 3.
Find an appropriate measure of dispersion from the following data. Also find its relative measure.
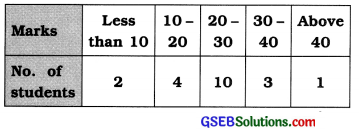
Answer:
Here, the given frequency distribution is open ended. Therefore, an appropriate measure of dispersion is Quartile deviation.
First Quartile:
Q1 class = Class that Includes \(\left(\frac{n}{4}\right)\)th observation
= Class that includes \(\left(\frac{20}{4}\right)\)th observation
= Class that observation 5th observation
Referring to column cf. Q1 class = 10 – 20
Now, Q1 = L + \(\frac{\left(\frac{n}{4}\right)-c f}{f}\) xc
Putting L = 10. \(\left(\frac{n}{4}\right)\) = 5. cf= 2.f= 4 and c = 10 in the formula,
Q1 = 10 + \(\frac{5-2}{4}\) × 10
= 10 + \(\frac{3 \times 10}{4}\) = 10 + 7.5 = 17.5 marks
Third Qurtile:
Q3 class = Class that Includes 3\(\left(\frac{n}{4}\right)\)th observation
= Class that Includes 3(5) th observation
= Class that includes 15th observation
Referring to column cf. Q3 class = 20 – 30
Now. Q3 = L + \(\frac{3\left(\frac{n}{4}\right)-c f}{f}\) × c
Putting L = 20. 3\(\left(\frac{n}{4}\right)\) = 15, cf = 6. f = 10 and c = 10 in the formula,
Q3 = 20 + \(\frac{15-6}{10}\) × 10 = 20 + 9 = 29marks
Quartile deviation:
Qd = \(\frac{Q_{3}-Q_{1}}{2}\)
= \(\frac{29-17.5}{2}=\frac{11.5}{2}\) = 5.75 marks
Relative measure of quartile deviation:
Coefficient of Quartile deviation = \(\frac{29-17.5}{29+17.5}=\frac{11.5}{46.5}\) = 0.25
Question 4.
The information of the salary of 200 employees of company is given below. Find the standard deviation of the salary of the employees:
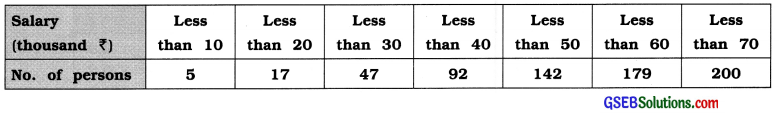
Answer:
Here, the given frequency distribution is ‘less than’ type cumulative frequency distribution. We find standard deviation by converting it into original frequency distribution. The defference between tax successive after boundary point is 10. Therefore class length c = 10.
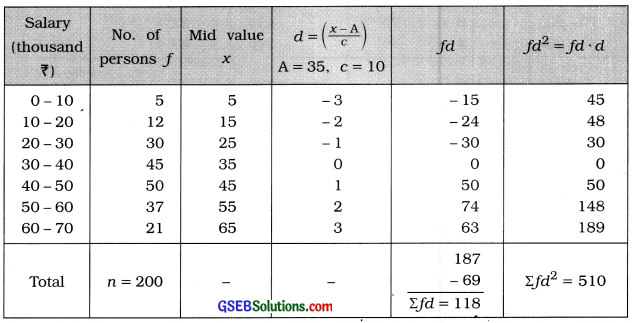
Standard deviation of wages of employees:
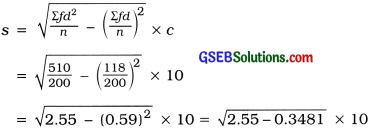
= \(\sqrt{2.2019}\) × 10
= 1.484 × 10
= ₹ 14.84 thousand
Question 5.
The following is a distribution of closing prices (in?) of shares of 100 different small scale industries on a certain day. Find the mean deviation of the closing prices of shares.
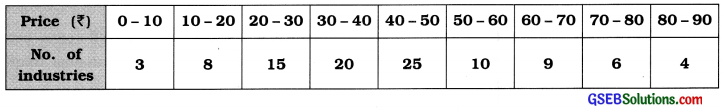
Answer:
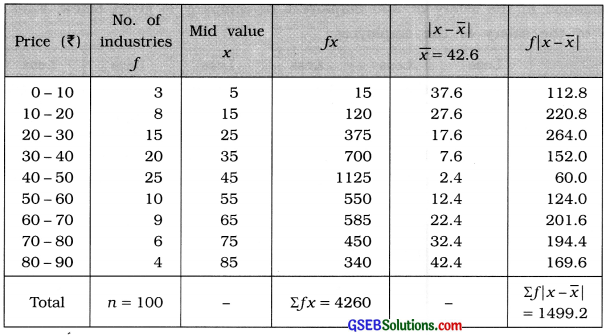
Mean:
x̄ = \(\frac{\Sigma f x}{n}=\frac{4260}{100}\) = ₹ 42.6
Mean deviation:
MD = \(\frac{\sum f|x-\bar{x}|}{n}=\frac{1499.2}{100}\) = ₹ 14.99
Question 6.
The information of daily wages (in of 230 workers of a factory is given below. Calculate the coefficient of variation from the following data for the daily wages of workers:
| Daily wages (₹) | No. of workers |
| Less than 100 | 12 |
| Less than 200 | 30 |
| Less than 300 | 65 |
| Less than 400 | 107 |
| Less than 500 | 157 |
| Less than 600 | 202 |
| Less than 700 | 222 |
| Less than 800 | 230 |
Answer:
The given distribution is ‘less than’ type cumulative frequency distribution. The difference between two successive upper boundary points is 100. Therefore class length c = 100. The original frequency distribution is obtained as follows:
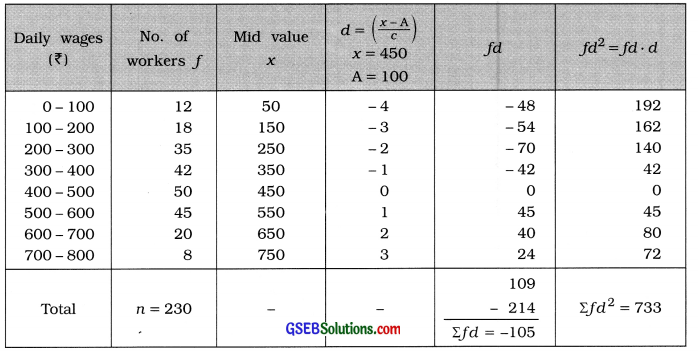
Mean:
x̄ = A + \(\frac{\Sigma f d}{n}\) × c
= 450 – \(\frac{105}{230}\) × 100
= 450 – \(\frac{1050}{23}\)
= 450 – 45.65
= ₹ 404.35
Standard deviation:
s = \(\sqrt{\frac{\Sigma f d^{2}}{n}-\left(\frac{\Sigma f d}{n}\right)^{2}}\) × c
= \(\sqrt{\frac{733}{230}-\left(\frac{-105}{230}\right)^{2}}\) × 100
= \(\sqrt{3.187-(-0.4565)^{2}}\) × 100
= \(\sqrt{3.187-0.208}\) × 100
= \(\sqrt{2.979}\) × 100
= 1.726 × 100
= ₹ 172.60
Coefficient of. variation:
Coeff. of variation = \(\frac{s}{\bar{x}}\) × 100
= \(\frac{172.60}{404.35}\) × 100
= 0.4268 × 100
= 42.68 %
Question 7.
The marks obtained by two students A and B in 10 sets of examinations are given below:
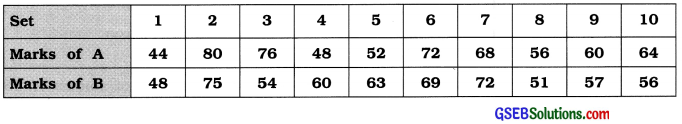
Which student is more consistent in his study?
Answer:
To determine which student is consistent in his study we will find the coefficient of variation of marks of both students A and B.
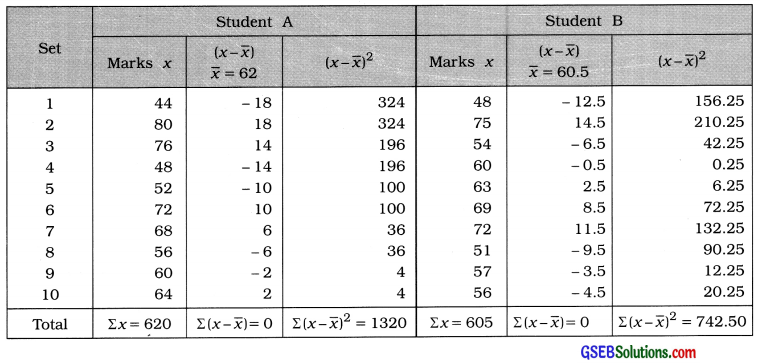
Student A
x̄ = \(\frac{\Sigma x}{n}\)
= \(\frac{620}{10}\)
= 620 marks
standard deviation:
s = \(\sqrt{\frac{\Sigma(x-\bar{x})^{2}}{n}}\)
= \(\sqrt{\frac{1320}{10}}\)
= \(\sqrt{132}\)
= 11.49 marks
Coefficient of variation:
Coeff. of variation = \(\frac{s}{\bar{x}}\) × 100
= \(\frac{11.49}{62}\) × 100
= 0.1852 × 100
= 18.53%
Student B
x̄ = \(\frac{\Sigma x}{n}\)
= \(\frac{605}{10}\)
= 60.5 marks
standard deviation:
s = \(\sqrt{\frac{\Sigma(x-\bar{x})^{2}}{n}}\)
= \(\sqrt{\frac{742.50}{10}}\)
= \(\sqrt{74.25}\)
= 8.62 marks
Coefficient of variation:
Coeff. of variation = \(\frac{s}{\bar{x}}\) × 100
= \(\frac{18.62}{60.5}\) × 100
= 0.1425 × 100
= 14.25%
The coefficient of variation of marks obtained by student B is less than that of student A. Hence, the performance of student B in his study is more consistent.
![]()
Question 8.
The following are the distributions of weights (in kg) for the students of two groups A and B. Find the coefficient of variation of each group. Which group has greater relative variation?
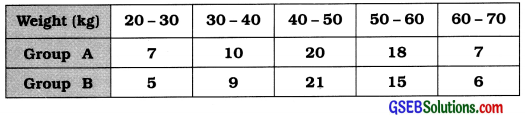
Answer:
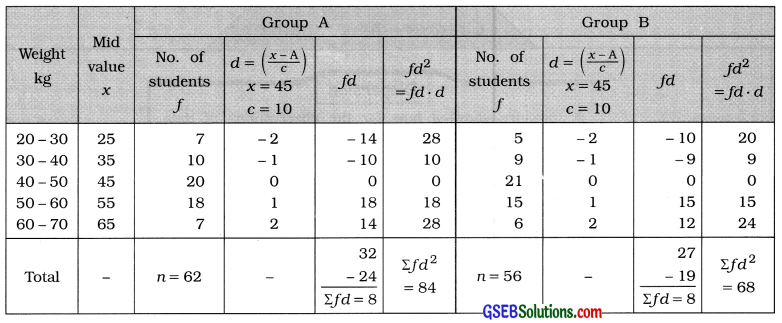
Group A:
Mean:
x̄ = A + \(\frac{\Sigma f d}{n}\) × c
Putting A = 45. Σfd = 8. n = 62 and c = 10
= 45 + \(\frac{8}{62}\) × 10
= 45 + \(\frac{80}{62}\)
= 45 + 1.29 = 46.29 kg
Standard deviation:
s = \(\sqrt{\frac{\Sigma f d^{2}}{n}-\left(\frac{\Sigma f d}{n}\right)^{2}}\) × c
= \(\sqrt{\frac{84}{62}-\left(\frac{8}{62}\right)^{2}}\) × 10
= \(\sqrt{1.355-(0.129)^{2}}\) × 10
= \(\sqrt{1.355-0.017}\) × 10
= \(\sqrt{1.338}\) × 10
= 1.157 × 10= 11.57 kg
Coefficient of variation:
Coeff. of variation = \(\frac{s}{\bar{x}}\) × 100
= \(\frac{11.57}{46.29}\) × 100
= 0.25 × 100 = 25 %
Group B:
Mean:
x̄ = A + \(\frac{\Sigma f d}{n}\) × c
Putting A = 45. Σfd = 8. n = 56 and c = 10
= 45 + \(\frac{8}{56}\) × 10
= 45 + \(\frac{80}{56}\)
= 45 + 1.43 = 46.43 kg
Standard deviation:
s = \(\sqrt{\frac{\Sigma f d^{2}}{n}-\left(\frac{\Sigma f d}{n}\right)^{2}}\) × c
= \(\sqrt{\frac{68}{56}-\left(\frac{8}{56}\right)^{2}}\) × 10
= \(\sqrt{1.214-(0.143)^{2}}\) × 10
= \(\sqrt{1.214-0.020}\) × 10
= \(\sqrt{1.194}\) × 10
= 1.093 × 10= 10.93 kg
Coefficient of variation:
Coeff. of variation = \(\frac{s}{\bar{x}}\) × 100
= \(\frac{10.93}{46.43}\) × 100
= 0.2354 × 100 = 23.54 %
The coefficient of variation of weights of students in Group A is more than that of weights of students in Group B. Hence, the relative variation of weights of students in Group A Is more.