Gujarat Board Statistics Class 11 GSEB Solutions Chapter 5 Skewness of Frequency Distribution Ex 5 Textbook Exercise Questions and Answers.
Gujarat Board Textbook Solutions Class 11 Statistics Chapter 5 Skewness of Frequency Distribution Ex 5
Section – A
Choose the correct alternative from those given below each question:
Question 1.
Generally, what is the range of coefficient of skewness for data where the mode is ill- defined?
(a) 0 to 1
(b) – 1 to +1
(c) – 3 to +3
(d) 1 to 0
Answer:
(c) – 3 to +3
Question 2.
For a frequency distribution having negative skewness, what will be the value of its mean?
(a) More than mode
(b) Less than mode
(c) Equal to mode
(d) Nothing can be said about mean
Answer:
(b) Less than mode
Question 3.
The following measures are obtained for two distributions.
Distribution (i) Mean = 44, Median = 48 and Standard deviation = 20 Distribution (ii) Mean = 44, Median = 50 and Standard deviation = 24 Which of the following statements is true?
(a) Distributions (i) and (ii) have same degree of skewness.
(b) Distribution (i) has more skewness than distribution (ii).
(c) Distribution (i) has less skewness than distribution (ii).
(d) Nothing can be said about skewness from the given data.
Answer:
(c) Distribution (i) has less skewness than distribution (ii).
Question 4.
Two measures of central tendency are given for the following three frequency distributions. All of them are unimodal distributions. State the type of skewness for the three distributions.
(i) Distribution A : mode =100 and mean =116
(ii) Distribution B : median = 142.8 and mean = 142.8
(iii) Distribution C : median = 208 and mean =192
(a) A is symmetric, B is negatively skewed and C is positively skewed.
(b) A is negatively skewed, B is positively skewed and C is symmetric.
(c) A is positively skewed, B is symmetric and C is negatively skewed.
(d) A is positively skewed, B is negatively skewed and C is symmetric.
Answer:
(c) A is positively skewed, B is symmetric and C is negatively skewed.
Question 5.
Mode of a frequency distribution exceeds its , mean by 2. What type of distribution is it?
(a) Negatively skewed
(b) symmetric
(c) positively skewed
(d) nothing can be said
Answer:
(a) Negatively skewed
Question 6.
If Q3 + Q1 = 60 and M = 30 for a frequency distribution, which of the following statements about its skewness is true?
(a) Distribution is highly skewed.
(b) Distribution is less skewed.
(c) Distribution has lack of symmetry.
(d) Distribution is symmetric.
Answer:
(d) Distribution is symmetric.
![]()
Question 7.
In a moderately skewed distribution, (mean – mode) will be how many times (mean – median)?
(a) 3
(b) – 1
(c) \(\frac{1}{3}\)
(d) 0
Answer:
(c) \(\frac{1}{3}\)
Question 8.
Which of the following statements is false for a negatively skewed frequency distribution?
(a) Value of mean is less than median and mode.
(b) The distance between the third quartile and ’ median is less than the distance between median and the first quartile.
(c) The left tail of the frequency curve of the distribution is more elongated.
(d) The distance between the third quartile and median is more than the distance between median and the first quartile.
Answer:
(d) The distance between the third quartile and median is more than the distance between median and the first quartile.
Question 9.
Which of the following statements is true for a symmetric distribution?
(a) Q3 = 2M – Q1
(b) Q2 – Q3 = Q2 – Q1
(c) Q3 + Q1 > 2M
(d) Q3 + Q1 < 2M
Answer:
(a) Q3 = 2M – Q1
Question 10.
If (M – x̄) = – \(\frac{1}{2}\)s, find the value of j.
(a) – \(\frac{1}{3}\)
(b) \(\frac{3}{2}\)
(c) = – 1.5
(d) 0.15
Answer:
(b) \(\frac{3}{2}\)
Question 11.
Which measure of central tendency has higher value in (i) negatively skewed distribution and (ii) positively skewed distribution?
(a) (i) mean (ii) mode
(b) (i) median (ii) mode
(c) (i) mode (ii) mean
(d) nothing can be said about mean, median and mode
Answer:
(c) (i) mode (ii) mean
Question 12.
If coefficients of skewness for distribution X is -0.99 and that of distribution Y is 0.90.
Which of the following statements is true?
(a) Distribution X is more skewed.
(b) Distribution Y is more skewed.
(c) Nothing can be said about skewness of X and Y.
(d) Distributions X and Y have same skewness.
Answer:
(a) Distribution X is more skewed.
Question 13.
Which of the following statements is false?
(a) If Q3 + Q1 > 2M the distribution is positively skewed.
(b) Bowley’s coefficient of skewness is found using positional averages.
(c) The absolute measure is divided by standard deviation in Karl Pearson’s method to eliminate the effect of unit of the variable whereas in Bowley’s method, the absolute measure is divided by the difference of quartiles.
(d) The frequencies of observations which are equidistant on both sides of the mode are equally distributed in a skewed distribution.
Answer:
(d) The frequencies of observations which are equidistant on both sides of the mode are equally distributed in a skewed distribution.
![]()
Question 14.
Which of the following statements is true?
(a) The distribution in which observations on both sides of mode are equally distributed is called negatively skewed distribution.
(b) The distances of median from the extreme quartiles are same in a symmetric distribution.
(c) If Sk > 0, x > M and x < M0
(d) If Sk < 0, x < M and x > M0
Answer:
(b) The distances of median from the extreme quartiles are same in a symmetric distribution.
Section – B
Answer the following question in one sentence:
Question 1.
What is meant by skewness?
Answer:
Lack of symmetry in a frequency distribution is called skewness.
Question 2.
When do we call a frequency distribution to be symmetric?
Answer:
A frequency distribution in which the observations of the population are evenly distributed on both the sides of the mode is called symmetric frequency distribution.
Question 3.
When do we say that a frequency distribution is skewed?
Answer:
If the frequency curve of a frequency distribution is not bell-shaped, then we say that a frequency distribution is skewed.
Question 4.
What can you say about the position of median in a skewed frequency distribution?
Answer:
In a skewed frequency distribution the position of median is always between the mean and mode.
Question 5.
Explain how to determine the skewness using a frequency curve.
Answer:
If the right tail of the frequency curve of a frequency distribution is more enlongated, we say that the frequency distribution is positively skewed and if the left tail of the frequency curve is more enlongated, we say that the frequency distribution is negatively skewed.
![]()
Question 6.
What is coefficient of skewness? State the range for its value.
Answer:
The relative measure of skewness is called the coefficient of skewness. It is the ratio of skewness to the dispersion. It is denoted by ‘j’. Usually the range of its value is -1 to 1. But when mode is undefined then its range is -3 to 3.
Question 7.
Which measures are used to obtain Karl Pearson’s measure of skewness?
Answer:
The measures of mean and mode are used to obtain Karl Pearson’s measure of skewness.
Question 8.
State the basic assumption of obtaining Bowley’s measure of skewness.
Answer:
The basic assumption of obtaining Bowley’s measure of skewness is “In a skewed frequency distribution the extreme quartiles Q1 and Q3 are not equidistant from the median M (Q2)”.
Question 9.
Which method gives more reliable value of coefficient of skewness?
Answer:
Karl Pearson’s method gives more reliable value of coefficient of skewness.
Question 10.
Coefficient of skewness is absolute measure or relative easure. Give reasons.
Answer:
Coefficient of skewness is a relative measure, because it is a ratio of skewness and dispersion and hence free from unit of measurement.
Question 11.
Which formula is used for finding coefficient of skewness when a distribution has open-ended classes?
Answer:
Formula j = \(\frac{Q_{3}+Q_{1}-2 M}{Q_{3}-Q_{1}}\) is used for finding coefficient of skewness when a distribution has open-ended classes.
Question 12.
What is the range for coefficient of skewness computed using Karl Pearson’s method for a frequency distribution with unequal class intervals?
Answer:
The range for coefficient of skewness computed using Karl Pearson’s method for a frequency distribution with unequal class intervals is – 3 to + 3.
Question 13.
State the type of skewness for a frequency distribution whose three quartiles are 42, 36 and 40.
Answer:
Here, Q1 = 36; M = 40; Q3 = 42
Q3 + Q1 = 42 + 36 = 78, 2M = 2 (40) = 80
Q3 + Q1 < 2M.
Therefore, frequency distribution is negatively skewed.
Question 14.
State the type of skewness for a frequency distribution where (Q3 – Q2) < (Q2– Q1)
Answer:
If in any frequency distribution of (Q3 – Q2) < (Q2 – Q1) then, the frequency distribution is negatively skewed.
Question 15.
The mean of a frequency distribution is less than its median by 2 units. State its type of skewness.
Answer:
Here, x̄ = M – 2. ∴ x̄ – M = – 2, which is negative. Therefore, skewness of frequency distribution is negative.
Question 16.
If Q3 + Q1 = 125 and M = 62.5, for a set of data, what can be said about its skewness?
Answer:
Q3 + Q1 = 125, M = 62.5 2M = 2 (62.5) = 125
Q3 + Q1 = 2M Therefore, frequency – distribution is symmetric.
![]()
Question 17.
If x̄ = M = M0 = 48 in a frequency distribution, what can you say about its coefficient?
Answer:
In a frequency distribution x̄ = M = M0 = 48. Therefore coefficient of skewness of the frequency distribution is zero and the frequency distribution is symmetric.
Section – C
Answer the following questions as required:
Question 1.
Explain the type of skewness.
Answer:
The types of skewness are two ;
(1) Positive skewness ; The right tail of the frequency curve is more enlongated. and
(2) Negative skewness ; The left tail of the frequency curve is more enlongated.
Question 2.
Show the positions of averages and quartiles using a diagram for each types of skewness.
Answer:
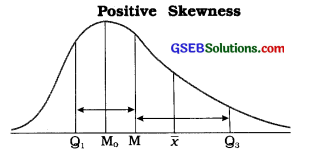
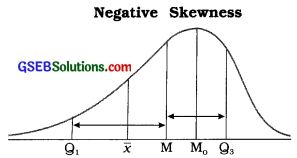
x̄ = Mean, M = Median, M0 = Mode, Q1 = First Quartile, Q3 = Third Quartile
Question 3.
State any two characteristics of symmetric distribution.
Answer:
Two characteristics of symmetric distribution are : (1) Its frequency curve is bell-shaped. and (2) The values of mean, median and mode are equal in it.
Question 4.
State any two characteristics of skewed distribution.
Answer:
Two characteristics of skewed distribution are :
- The values of mean, median are not equal in it and
- both quartiles Q1 and Q3 are not equidistant form the median i.e., (Q3 – M) ≠ (M – Q1).
Question 5.
For a frequency distribution, skewness Sk = – 2.8. If its mode is 48.8, find mean.
Answer:
Sk = – 2.8, M0 = 48.8, x̄ =?
Now, Sk = x̄ – M0
∴ -2.8 = x̄ – 48.8
∴ 48.8 – 2.8 = x̄
∴ x̄ = 46
![]()
Question 6.
Sum of two extreme quartiles is 138 in a symmetric frequency distribution. Find its median.
Answer:
In symmetric frequency distribution,
Q3 + Q1 = 2M
∴ 138 = 2M
∴ M = \(\frac{138}{2}\) = 69
Question 7.
The coefficient of a skewed frequency distribution is 0.75. If its standard deviation is 20 and mean is 37.5, find median.
Answer:
j = 0.75, s = 20. x̄ = 37.5. M = ?
Now, j = \(\frac{3(\bar{x}-M)}{s}\)
∴ 0.75 = \(\frac{3(37.5-\mathrm{M})}{20}\)
∴ 0.75 × 20 = 112.5 – 3M
∴ 15 = 112.5 – 3M
∴ 3M = 112.5 – 15
∴ 3M = 97.5
∴ M = 32.50
Question 8.
The mean of a skewed distribution exceeds its median by 3. If its coefficient of skewness is 0.75, find standard deviation.
Answer:
Here, x̄ = M + 3 ∴ x̄ – M = 3;
j = 0.75; s =?
Now, j = \(\frac{3(\bar{x}-\mathrm{M})}{s}\)
∴ 0.75 = \(\frac{3(3)}{s}\)
∴ 0.75s = 9
∴ s = \(\frac{9}{0.75}\)
∴ s = 12
Question 9.
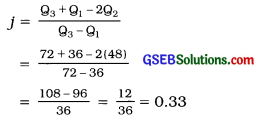
If a frequency distribution has Q3 – Q2 = 2(Q2 – Q1). find j.
Answer:
Here, Q3 – Q2 = 2(Q2 – Q1)
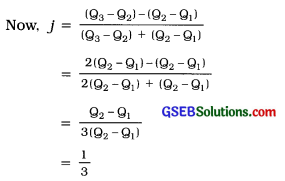
∴ J = 0.33
Question 10.
If a frequency distribution has skewness Sk = -6.6 and quartiles deviation = 22 find j.
Answer:
Here. Sk = -6.6; Qd = 22; j =?
Sk = (Q3 + Q1) – 2M
∴ -6.6 = Q3 + Q1 – 2M
Qd = 22
∴ \(\frac{\mathrm{Q}_{3}-\mathrm{Q}_{1}}{2}\) = 22
Now, j = \(\frac{\mathrm{Q}_{3}+\mathrm{Q}_{1}-2 \mathrm{M}}{\mathrm{Q}_{3}-\mathrm{Q}_{1}}\)
= \(\frac{S_{k}}{Q_{3}-Q_{1}}\)
= \(\frac{-6.6}{44}\)
∴ j = -0.15
Question 11.
A skewed frequency distribution has mean=40, mode=46, Q3 + Q1 = 76 and
Q3 – Q1 = 20. Find Bowley’s coefficient of skewness.
Answer:
Here, = 40; M0 = 46: Q3 + Q1 = 76;
Q3 – Q1 =20; J =?
Now. M0 = 3M – 2
∴ 46 = 3M – 2(40)
∴ 46 + 80 = 3M
∴ M = \(\frac{126}{3}\) = 42
j = \(\frac{Q_{3}+Q_{1}-2 M}{g_{3}-Q_{1}}\)
= \(\frac{76-2(42)}{20}\)
= \(\frac{76-84}{20}\)
= \(\frac{-8}{20}\)
∴ j = -0.4
Question 12.
“The coefficient of skewness obtained by Bowley’s method is not more reliable than the coefficient by Karl Pearson’s method.” Explain this statement.
Answer:
To obtain the coefficient of skewness by Bowley’s method, the measures of positional average – quartiles are used. Quartiles are not based on all the observations of the data, while obtaining the coefficient of skewness by Karl Pearson’s method, the measures of average mean, and median and measure of dispersion – standard deviation are used. All these measures all based on all the observations of the data. Therefore, the value of coefficient of skewness obtained by Karl Pearson’s method is more reliable than the coefficient of skewness obtained by Bowley’s method.
In Bowley’s method, to find the coefficient of skewness only middle 50 % of observations of a frequency distribution are used instead of using all the observations of a frequency distribution. Hence, Bowley’s method is not more reliable than Karl Pearson’s method.
Question 13.
The three quartiles of a frequency distribution are 76, 98 and 40. Find j and state the type of skewness.
Answer:
Here, Q1 = 40; M = 76: Q3 = 98.
Now j = \(\frac{Q_{3}+Q_{1}-2 M}{Q_{3}-Q_{1}}\)
= \(\frac{98+40-2(76)}{98-40}\)
= \(\frac{138-152}{58}=\frac{-14}{58}\) = – 0.24
∴ j = – 0.24. Therefore, the frequency distribution is negatively skewed.
Question 14.
The coefficient of skeweness of a distribution is 0.85. If its mean is 3.4 more than its mode, find its variance.
Answer:
Here, j = 0.85; x̄ = M0 + 3.4; s2 =?
Now, j = \(\frac{\bar{x}-M_{0}}{s}\)
∴ 0.85 = \(\frac{\mathrm{M}_{\mathrm{o}}+3.4-\mathrm{M}_{\mathrm{o}}}{s}\)
∴ 0.85s = 3.4
∴ s = \(\frac{3.4}{0.85}\)
∴ s = 4
Now, variance = s2
∴ variance = (4)2 = 16
![]()
Question 15.
If a frequency distribution has x̄ + M0 = 82, = 44 and s = 12. find coefficient of skewness.
Ans.wer:
Here. x̄ + M0 = 82 and = 44, s = 12
∴ 44 + M0 = 82
∴ M0 = 82 – 44 = 38
Now j = \(\frac{\bar{x}-\mathrm{M}_{0}}{s}\)
= \(\frac{44-38}{12}=\frac{6}{12}\)
∴ j = 0.5
Section – D
Answer the following questions as required:
Question 1.
Briefly explain Karl Pearson’s method of finding the coefficient of skewness.
Answer:
Karl Pearson’s method : Base : In a skewed frequency distribution the values of mean, median and mode are not equal.
Measure of skewness: The value of median lies always between the mean and mode. Therefore, the difference between the values of mean and mode is being used to obtain the measure of skewness (Sk), i.e.,
Sk = x̄ – M0 where, x = Mean, M0 = Mode
Relative measure of skewness : In a unimodal frequency distribution, the relative measure of skewness called coefficient of skewness is obtained by dividing the measure of skewness (Sk) by the standard deviation (s). It is denoted by ‘j’ and the range of its value is -1 to 1.
Thus, j = \(\frac{s_{k}}{s}=\frac{\bar{x}-\mathrm{M}_{0}}{s}\), -1 ≤ j ≤ 1.
When mode is not defined:
Measure of skewness: The value of mode is obtained by using emperical formula, i.e., M0 = 3M – 2x̄
Now, Sk = x̄ – M0
= x̄ – (3M – 2x̄)
= x̄ – 3M + 2x̄
= 3x̄ – 3M = 3(x̄ – M)
Relative measure of skewness:
j = \(\frac{3(\bar{x}-\mathrm{M})}{s}\) -3 ≤j ≤ +3
To obtain the reliable measure of skewness this method is widely used.
Question 2.
Write a short note on Bowley’s method of finding the coefficient of skewness.
Answer:
Bowley’s method : Base : In a skewed frequency distribution, both quartiles Q1 and Q3 are not equidistant from the median M.
Measure of skewness: Using the distances of quartiles from median, i.e., (Q3 – M) and (M – Q1), the measure of skewness Sk is obtained as follows:
Sk = (Q3 – M) – (M – Q1)
= Q3 – M – M + Q1
Sk = Q3 + Q1 – 2M
Relative measure of skewness : Dividing the absolute measure of skewness by the sum of distances (Q3 – M) and (M – Q1), the relative measure of skewness-the coefficient of skewness (j) is obtained, i.e.,
J = \(\frac{S_{k}}{\left(Q_{3}-M\right)+\left(M-Q_{1}\right)}\)
= \(\frac{Q_{3}+Q_{1}-2 M}{Q_{3}-Q_{1}}\)
-» If distances (Q3 – M) and (M – Q1) are positive, then their difference may be less than or equal to their sum. Hence, | j | ≤ 1, i.e., – 1 ≤ j ≤ 1.
-» This method is used when we have to compute the skewness by using positional average.
-> This is the only method to calculate skewness when the frequency distribution has open-end classes.
Question 3.
State the circumstances in which Karl Pearson’s formula j = 3\(\left(\frac{\bar{x}-\mathbf{M}}{s}\right)\) is used to find coefficient of skewness.
Answer:
Under the following circumstances in which Karl Pearson’s formula j = 3\(\left(\frac{\bar{x}-\mathbf{M}}{s}\right)\) is used to find coefficient of skewness :
- When the frequency distribution is bimodal.
- When the frequency distribution is of unequal class length.
- When the frequency distribution is of mixed type of discrete and continuous distribution.
![]()
Question 4.
Differentiate between positive and negative skewness with details and using a diagram.
Answer:
| Positive skewness | Negative skewness |
| 1. In a positively skewed frequency distribution the values of mean, median and mode are in descending order, i.e., x > M > M0 | l.In a negatively skewed frequency distribution the values of mean, median and mode are in ascending order, i.e., x < M < M0 |
| 2. The distance between third quartile Q3 and median M is greater than the distance between median M and first quartile Q1 i.e., (Q3 – M) > (M – Q1). | 2. The distance between third quartile Q3 and median M is less than the distance between median M and first quartile Q1, i.e., (Q3 – M) < (M – Q1). |
3. The right tail of the frequency curve is more enlongated.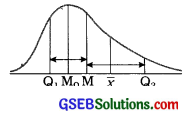 |
3. The left tail of the frequency curve is more enlongated.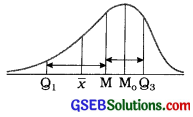 |
Question 5.
Which of the following populations is closer to symmetry?
Population A : x̄ = 56, M0 = 60 and s = 24
Population B : x̄ = 56, M = 60 and s = 30
Answer:
Population A:
x̄ = 56, M0 = 60, s = 24
Coefficient of skewness:
j = \(\frac{\bar{x}-\mathrm{M}_{0}}{s}\)
= \(\frac{56-60}{24}\)
= \(\frac{-4}{24}\) = -0.17
Population B:
x̄ = 56, M = 60, s = 30
Coefficient of skewness:
j = \(\frac{3\bar{x}-\mathrm{M}_{0}}{s}\)
= \(\frac{3\{56-60\}}{30}\)
= \(\frac{3(-4)}{30}\) = -0.17
For population A, j = -0.17 and for population B, j = – 0.4. Therefore population A is more nearer to symmetry.
[ Note: For comparison signs of j are ignored. ]
Question 6.
Find coefficient from the following data using an appropriate method and determine which population is more skewed among A and B:
Population A : 4Q1 = 3Q2 = 2Q3 = 144
Population B : Q1 = 34.8, Q2 = 45.5 and Q3 = 70
Answer:
Population A:
4Q1 = 3Q2 = 2Q3 = 144
4Q1 = 144 ∴ Q1 = \(\frac{144}{4}\) = 36
3Q2 = 144 ∴ Q2 = \(\frac{144}{3}\) = 48
2Q3 = 144 ∴ Q3 = \(\frac{144}{2}\) = 72
Coefficient of skewness:
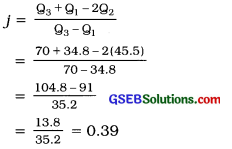
Population B:
Q1 = 34.8
Q2 = 45.5
Q3 = 70
Coefficient of skewness:
Question 7.
Third quartile ¡s at a distance of 12.8 from the median in a frequency distribution and its first quartile is at a distance of 11.2 from the median. Find skewness and its coefficient.
Answer:
Here. (Q3 – M) = 12.8 and (M – 1) = 11.2
Skewness:
Sk = (Q3 – M) – (M – Q1)
= 12.8 – 11.2
= 1.6
Coefficient of skewness:
j = \(\frac{\left(Q_{3}-M\right)-\left(M-Q_{1}\right)}{\left(Q_{3}-M\right)+\left(M-Q_{1}\right)}\)
= \(\frac{S_{k}}{\left(Q_{3}-M\right)+\left(M-Q_{1}\right)}\)
= \(\frac{1.6}{12.8+11.2}\)
= 0.07
![]()
Question 8.
If coefficient of variation is 25 %, x̄ = 32 and M0 = 32.2 for a set of data, find its coefficient of skewness.
Answer:
Here, coefficient
x̄ = 32, M0 = 32.2
Now, coefficient of variation = \(\frac{s}{\bar{x}}\) × 100
25 = \(\frac{s}{32}\) × 100
\(\frac{25 \times 32}{100}\) = s
∴ s = 8
Coefficient of skewness:
j = \(\frac{\bar{x}-\mathrm{M}_{0}}{s}\)
= \(\frac{32-32.2}{8}\)
= \(\frac{-0.2}{8}\)
= -0.025
Question 9.
Find coefficient of skewness from the following data:
n = 20. Σx = 640. Σx2 = 20,800 and M = 323
Answer:
Here, n = 20. Σx = 640. Σx2 = 20,800 and M = 323
Mean:
x̄ = \(\frac{\Sigma f x}{n}=\frac{640}{20}\) = 32
Standard deviation:
s = \(\sqrt{\frac{\Sigma f x^{2}}{n}-\left(\frac{\Sigma f x}{n}\right)^{2}}\)
= \(\sqrt{\frac{20800}{20}-\left(\frac{640}{20}\right)^{2}}\)
= \(\sqrt{1040-1024}\)
= √16 = 4
Coefficient of skewness:
j = \(\frac{3(\bar{x}-M)}{s}\)
= \(\frac{3(32-32.2)}{4}\)
= \(\frac{3(-0.2)}{4}\)
= \(\frac{-0.6}{4}\)
= – 0.15
Question 10.
Karl Pearson’s coefficient of skewness for a data set Is -0.6. If mean = 60 and s = 10, find median and mode for the data.
Answer:
Here, j = -0.60 x̄ = 60 s = 10
Mode:
j = \(\frac{\bar{x}-\mathrm{M}_{o}}{s}\)
∴ – 0.60 = \(\frac{60-M_{0}}{10}\)
∴ -0.60 × 10 = 60 – M0
∴ -6 = 60 – M0
∴ M0 = 60 +6 = 66
Therefore, mode = 66.
Median:
M0 = 3M – 2x
∴66 = 3M – 2 (60)
∴ 66 = 3M – 120
∴ 66 + 120 = 3M
∴ 3M = 186
∴ M = \(\frac{186}{3}\)
Therefore, median = 62
Question 11.
Karl Pearson’s skewness for a frequency distribution is 8 and coefficient of skewness is = \(\frac{2}{3}\). If the mean is 64, fInd its median and coefficient of variation.
Answer:
Here, Sk = 8; j = \(\frac{2}{3}\), x̄ = 64
Median:
Sk = 3(x̄ – M)
∴ 8 = 3(64 – M)
∴ 8 = 192 – 3M
∴ 3M = 192 – 8
∴M = \(\frac{184}{3}\)
∴ M = 61.33
Standard deviation:
j = \(\frac{S_{k}}{s}\)
∴ \(\frac{2}{3}=\frac{8}{s}\)
∴ 2s = 24
∴ s = 12
Coefficient of variation:
Coefficient of variation = \(\frac{s}{\bar{x}}\) × 100
= \(\frac{12}{64}\) × 100
= 18.75%
Question 12.
Find the coefficient of skewness for a frequency distribution with Q3 + Q1 = 15M and 3(Q3 – Q1) = 2M.
Answerr:
Here, Q3 + Q1 = 1.5M
3(Q3 – Q1) = 2M
∴ Q3 + Q1 = \(\frac{2}{3}\)M
Now, coefficient of skewness
j = \(\frac{Q_{3}+Q_{1}-2 M}{Q_{3}-Q_{1}}\)
= \(\frac{1.5 \mathrm{M}-2 \mathrm{M}}{\frac{2}{3} \mathrm{M}}\)
= \(\frac{-0.5 \mathrm{M}}{\frac{2}{3} \mathrm{M}}=\frac{-0.5 \times 3}{2}=-\frac{1.5}{2}\) = -0.75
![]()
Question 13.
A frequency distribution has 4x̄ = 6M0 =144, s = 64 and Q3 + Q1 = 6(Q3 – Q1) = 60.
Find the coefficient using Karl Pearson’s and Bowley’s method.
Answer:
Here, 4x̄ = 6M0 = 144
∴4x̄ = 144
6M0 = 144
∴ x̄ = \(\frac{144}{4}\) = 36
M0 = \(\frac{144}{6}\) = 24
Karl Pearson’s method:
x̄ = 36, M0 = 24, s = 64
Coefficient of skewness:
j = \(\frac{\bar{x}-\mathrm{M}_{\mathrm{o}}}{s}=\frac{36-24}{64}=\frac{12}{64}\) = 0.19
Bowley’s method:
Q3 + Q1 = 6(Q3 – Q1) = 60
∴ Q3 + Q1 = 60 and 6(Q3 – Q1) = 60
Now, M0 = 3M – 2x̄
∴ 24 = 3M – 2(36)
∴ 24 + 72 = 3M
∴ M = \(\frac{96}{3}\) = 32
Coefficient of skewness:
j = \(\frac{Q_{3}+Q_{1}-2 M}{Q_{3}-Q_{1}}\)
= \(\frac{60-2(32)}{10}\)
= \(\frac{60-64}{10}\)
= \(\frac{-4}{10}\)
= -0.4
Section – E
Answer the following questions as required:
Question 1.
Define skewed frequency distribution and state its characteristics.
Answer:
The frequency distribution with lack of symmetry is called skewed frequency distribution.
Characteristics of skewed frequency distribution:
- The values of mean, median and mode are not same, i.e., x ≠ M ≠ M0
- Quartiles Q1 and Q3 are not equidistant from median M, i.e., (Q3 – M) ≠ (M – Q1)
- The right or left tail of the frequency curve of a frequency distribution is more enlongated, i.e., the frequency curve is not bell-shaped.
- The frequency of observation at equidistant on both the sides of mode is not evenly distributed.
Question 2.
Define symmetric frequency distribution and state its characteristics.
Answer:
The frequency distribution In which the observations are evenly distributed on both the sides of mode Is called symmetric frequency distribution.
Characteristics of symmetric frequency distribution:
- The values of mean, median and mode are same, i.e., x = M = M0
- Quartiles Q1 and Q3 are equidistant from median M. i.e., (Q3 – M) = (M – Q1).
- The frequency curve is bell-shaped.
- The frequency of observation at equal distance on both the sides of mode is evenly distributed.
Question 3.
Differentiate: Karl Pearson’s and Bowley’s method for coefficient of skewness.
Answer:
| Karl Pearson’s method | Bowley’s method |
| 1. In a skewed frequency distribution ‘the values of mean, median and mode are not equal’. This base is used to obtain the measure of skewness. | 1. In a skewed frequency distribution ‘the quartiles Q1 and Q3 are not equidistant from median M’. This base is used to obtain the measure of skewness. |
| 2. Value of median always lies between mean and mode. Hence, the skewness is found by the formula Sk = x̄ – M0. Dividing this measure by standard deviation s, Karl Pearson’s coefficient of skewness is obtained by following formula: j = \(\frac{\bar{x}-\mathrm{M}_{0}}{s}\) When the mode is undefined j = \(\frac{3(\bar{x}-M)}{s}\) |
2. Q3 and Q1 are not equidistant from median M. Hence, skewness is obtained by the formula Sk = (Q3 – M) – (M – Q1) = Q3 + Q1 – 2M. Dividing the measure by sum of differences Bowley’s coefficient of skewness is obtained by the following formula: j = \(\frac{\left(Q_{3}-M\right)-\left(M-Q_{1}\right)}{\left(Q_{3}-M\right)+\left(M-Q_{1}\right)}=\frac{Q_{3}+Q_{1}-2 M}{Q_{3}-Q_{1}}\) |
| 3. Usually, the value of coefficient of skewness j lies between -1 and +1. But when M0 is undefined, the value of j lies between -3 and + 3. | 3. The value of coefficient of skewness lies between -1 and + 1. |
| 4. The Value of coefficient of skewness obtained by this method is more reliable. | 4. The value of coefficient of skewness, obtained by this method is less reliable than the value of coefficient of skewness obtained by Karl Pearson’s method. |
| 5. In this method all observations of the data are used to find the coefficient of skewness. | 5. All observations of the data are not used to find the coefficient of skewness in this method. But, the observations, related only to Q1; Q3 and M are used. |
| 6. The coefficient of skewness cannot be obtained by this method for frequency distribution with open-ended classes. | 6. This method is more appropriate to find the skewness and coefficient of skewness for frequency distribution with open-ended classes. |
Question 4.
Explain skewness and coefficient of skewness.
Answer:
Skewness: Measures of central tendency and dispersion are useful for comparing two or more data. But they cannot give Information about whether the observations of the data are symmetrically distributed or not. This Information can be obtained from the frequency curve of thc frequency distribution. If frequency curve Is symmetric on both sides from Its peak point. It Is said that observations of the data are distributed symmetrically. But, if it is not so, we call it skewness in frequency distribution. Thus, skewness gives an idea about nature of the data with respect to shape of frequency curve. In short, skewness implies the lack of symmetry in frequency distribution of the data.
- The skewness of a frequency distribution may be positive or negative which can be determined by the shape of frequency curve.
- The measure of skewness can be obtained by using the measures of average – mean, median, mode and the measures of positional average – quartiles (Q1, Q3), median (M). Symbolically, it is denoted by Sk.
- Absolute measure of skewness is Sk = x – M0 or Sk = 3(x – M)
OR Sk = Q3 + Q1 – 2M. - Absolute measure of skewness, cannot be used for comparing skewness of two or more frequency distributions.
Coefficient of skewness: It is a relative measure of skewness which is free from unit of measurement. It is denoted by symbol j.
- Coefficient of skewness can be used for comparing the skewness of two or more frequency distributions.
- It is obtained by dividing the absolute measure of skewness by an appropriate measure of dispersion, i.e., j = \(\frac{S_{k}}{s}\) or j = \(\frac{s_{k}}{Q_{3}-Q_{1}}\)
![]()
Question 5.
What are the main objectives of studying skewness?
Answer:
The main objectives of studying skewness are as follows :
- To get complete information of the data with respect to the direction, shape and form of the frequency curve of the frequency distribution.
- To obtain more information about the population by studying the symmetry of the frequency curve.
- To study whether the frequency of observation at equidistant on both sides of mode is evenly distributed or not.
Question 6.
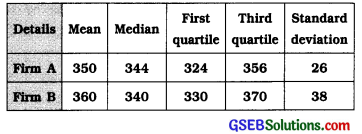
Various measures for the frequency distributions of monthly salaries of two production firms are as follows. Compare the firms using coefficient of skewness by Bowley’s and Karl Pearson’s method:
Answer:
Firm A:
x̄ = 350, M = 344, Q1 = 324, Q3 = 356, s = 26
Karl Pearson’s method:
Coefficient of skewness:
j = \(\frac{3(\bar{x}-M)}{s}\)
= \(\frac{3\{350-344)}{26}\)
= \(\frac{3(6)}{26}\)
= \(\frac{18}{26}\)
= 0.69
Bowley’s method: Coefficient of skewness:
j = \(\frac{Q_{3}+Q_{1}-2 M}{Q_{3}-Q 1}\)
= \(\frac{356+324-2(344)}{356-324}\)
= \(\frac{680-688}{32}\)
= \(\frac{-8}{32}\)
= -0.25
Firm B:
x̄ = 360, M = 340, Q1 = 330. Q3 = 370, s = 38
Karl Pearson’s method:
Coefficient of skewness:
j = \(\frac{3(\bar{x}-\mathrm{M})}{\mathrm{s}}\)
= \(\frac{3(360-340)}{38}\)
= \(\frac{3(20)}{38}\)
= \(\frac{60}{38}\)
= 1.58
Bowley’s method :
Coefficient of skewness:
j = \(\frac{Q_{3}+Q_{1}-2 M}{Q_{3}-Q 1}\)
= \(\frac{370+330-2(340)}{370-330}\)
= \(\frac{700-680}{40}\)
= \(\frac{20}{40}\)
= 0.5
Karl Pearson’s method: The skewness in the data of firm B is more than that of firm A.
Bowley’s method: The skewness in the data of firm B is more than that of firm A.
Question 7.
The frequency distribution of sale of notebooks from a stationery shop in the month of June for the year 2014 is as follows. Find coefficient of skewness using Karl Pearson’s method.
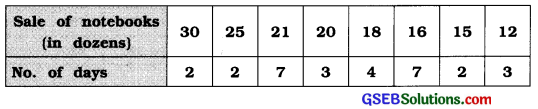
Answer:
We write the observation of sale of notebooks in the ascending order. Maximum frequency 7 curves twice. Therefore, mode Is undefined using the formula j = \(\frac{3(\bar{x}-M)}{s}\) we will find coefficient of skewness.
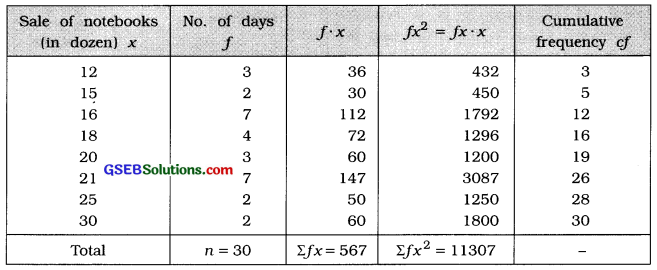
Mean:
x̄ = \(\frac{\Sigma f x}{n}\)
= \(\frac{567}{30}\)
= 18.9 dozens
Median:
M = Value of \(\)th observation
= value of \(\)th observation
= Value of 15.5th observation
Referring to column cf
M = 18 dozens
Standard deviation:
Coefficient of skewness by Karl Pearson’s method:
j = \(\frac{3(\bar{x}-\mathrm{M})}{s}\)
= \(\frac{3(18.9-18)}{4.44}\)
= \(\frac{3(0.9)}{4.44}=\frac{2.7}{4.44}\)
∴ j = 0.61
![]()
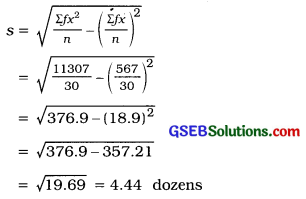
Question 8.
The following information is available about defective staplers after testing 50 packets of 500 staplers each. Find coefficient of skewness using Karl Pearson’s method.
Answer:
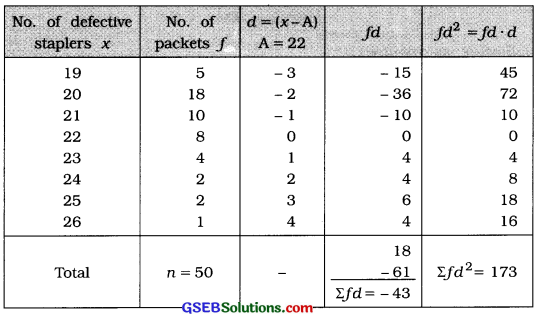
Mean:
x = A + \(\frac{\sum f d}{n}\)
= 22 – \(\frac{43}{50}\)
= 22 – 0.86
= 21.14 packets
Mode:
M0 = The observation having maximum frequency 18
= 20 packets
Standard deviation:
s = \(\sqrt{\frac{\Sigma f d^{2}}{n}-\left(\frac{\Sigma f d}{n}\right)^{2}}\)
= \(\sqrt{\frac{173}{50}-\left(\frac{-43}{50}\right)^{2}}\)
= \(\sqrt{3.46-(-0.86)^{2}}\)
= \(\sqrt{3.46-0.7396}=\sqrt{2.7204}\)
= 1.65 packets
Coefficient of skewness by Karl Pearson’s method:
j = \(\frac{\bar{x}-\mathrm{M}_{0}}{s}\)
= \(\frac{21.14-20}{1.65}=\frac{1.14}{1.65}\)
∴ j = 0.69
Question 9.
For the frequency distribution of a set of data, n = 200, f (x -240) = 0, f (x – 240)2 = 11.250 and median = 246, fInd coefficient of skewness and state the type of skewness:
Answer:
Here, n = 200; Σf (x – 240) = 0 ∴ x̄ = 240
Σf(x – 240)2 = Σf(x – x̄)2 = 11,250; M = 246
Mean:
x̄ = 240
Standard deviation:
s = \(\sqrt{\frac{\sum f(x-\bar{x})^{2}}{n}}\)
= \(\sqrt{\frac{11250}{200}}\)
= \(\sqrt{56.25}\)
= 7.5
Median : M = 246
Coefficient of skewness:
j = \(\frac{3(\bar{x}-M)}{s}\)
= \(\frac{3(240-246)}{7.5}\)
= \(\frac{3(-6)}{7.5}\)
= \(\frac{-18}{7.5}\)
= -2.4.
Type of skewness:
j = – 2.4. Therefore, the frequency distribution is negatively skewness.
Section – F
Answer the following as required:
Question 1.
The frequency distribution of number of accidents due to driving for more than the prescribed time is given below. Find coefficient of skewness by Bowley’s method.
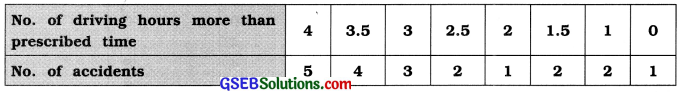
Answer:
Writing the observations of driving hours in ascending order, we find the coefficient skewness by Bowley’s method.
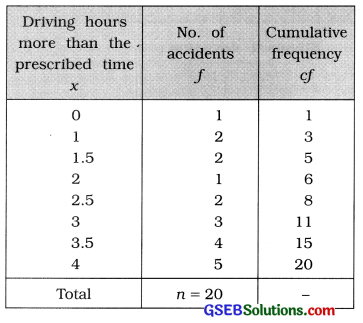
First Quartile:
Q1 = value of \(\left(\frac{n+1}{4}\right)\)th observation
= value of \(\left(\frac{20+1}{4}\right)\)th observation = value of 5.25th observation
Referring to column cf,
Q1 = 2 hours
Median :
M = value of \(\left(\frac{n+1}{2}\right)\)th observation
= value of \(\left(\frac{20+1}{4}\right)\)th observation = value of 10.5th observation Referring to column cf,
M = 3 hours
Third Quartile :
Q3 = value of 3\(\left(\frac{n+1}{4}\right)\)th observation
= value of 3 (5.25) th observation
= value of 15.75th observation
Referring to column cf Q3 = 4 hours
Coefficient of skewness by Bowley’s method :
j = \(\frac{Q_{3}+Q_{1}-2 M}{Q_{3}-Q_{1}}\)
= \(\frac{4+2-2(3)}{4-2}\)
= \(\frac{0}{2}\)
∴ j = 0
![]()
Question 2.
The daily temperature of a city in the year 2014 is recorded as follows. The daily temperature has not been below -10° C. Find Karl Pearson’s coefficient of skewness. State the type of skewness.

Answer:
Here, mid values are given. Therefore, class limits of a mid value are obtained as follows. Note that the distances between two successive mid values are not equal.
Temperature is not below -10°. Therefore, the lower limit of the initial class will be -10°.
upper limit + lower limit
Now, Mid value = \(\frac{\text { upper limit + lower limit }}{2}\)
∴ – 5 = \(\frac{\text { upper limit }+\left(-10^{\circ}\right)}{2}\)
∴ – 10 = Upper limit – 10°
Upper limit = -10 + 10 = 0
Thus, initial class we get – 10 to 0.
Obtaining the class limits for rest of the mid values the frequency distribution is obtained as follows. Class length is unequal, therefore mode is not defined and we calculate coefficient of skewness by using the formula j = \(\frac{3(\bar{x}-\mathrm{M})}{s}\)
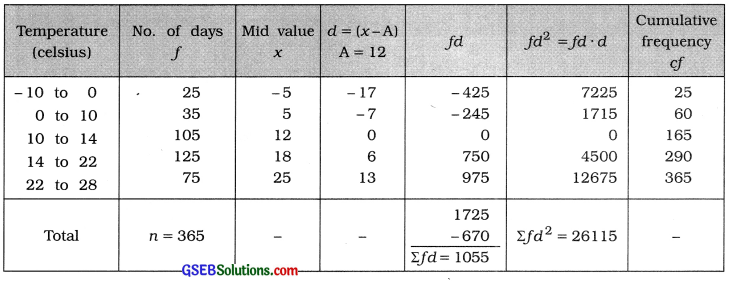
Mean:
x̄ = A + \(\frac{\Sigma f d}{n}\)
= 12 + \(\frac{1055}{365}\)
= 12 + 2.89 = 14.89 celsius
Median:
M class = class that includes \(\left(\frac{n}{2}\right)\)th observation
= class that includes \(\left(\frac{365}{2}\right)\)th observation
= class that includes 182.5th observation
Referring to column cf, M class = 14 – 22
Now, M = L + \(\frac{\frac{n}{2}-c f}{f}\) × c
Putting L = 14, \(\frac{n}{2}\) = 182.5, cf = 165, f = 125 and c = 8 in the formula,
M = 14 + \(\frac{182.5-165}{125}\) × 8
= 14 + \(\frac{17.5 \times 8}{125}\)
= 14 + \(\frac{140}{125}\) = 14 + 1.12 = 15.12 celsius
Standard deviation:
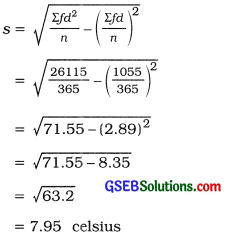
Karl Pearson’s coefficient of skewness:
j = \(\frac{3(\bar{x}-\mathrm{M})}{s}\)
= \(\frac{3(14.89-15.12)}{7.95}\)
= \(\frac{3(-0.23)}{7.95}\)
= \(\frac{-0.69}{7.95}\)
= -0.087
Question 3.
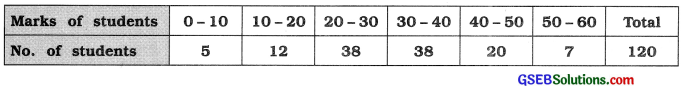
The distribution of marks obtained by 60 students in aa examination is as follows. Find coefficient of skewness by Karl Pearson’s method and state the type of skewness.
Answer:
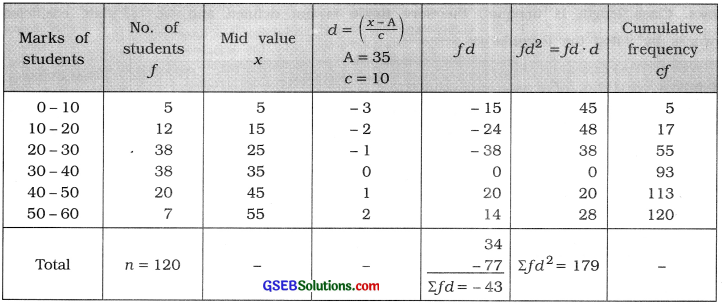
In the given frequency distribution maximum frequency 38 occurs twice. Therefore, mode is undefined. We calculate coefficient of skewness using the formula j = \(\frac{3(\bar{x}-\mathrm{M})}{s}\)
Mean:
x̄ = A + \(\frac{\Sigma f d}{n}\)
= 35 – \(\frac{43}{120}\)
= 35 – \(\frac{43}{12}\)
= 35 – 3.58 = 31.42 marks
Median:
M class = class that includes \(\left(\frac{n}{2}\right)\)th observation
= class that includes \(\left(\frac{120}{2}\right)\)th observation
= class that includes 60th observation
Referring to column cf, M class = 30 – 40
Now, M = L + \(\frac{\frac{n}{2}-c f}{f}\) × c
Putting L = 30, \(\frac{n}{2}\) = 60, cf = 55, f = 38 and c = 10 in the formula,
M = 30 + \(\frac{60-55}{38}\) × 10
= 30 + \(\frac{5 \times 10}{38}\)
= 30 + \(\frac{50}{38}\) = 30 + 1.32 = 31.32 marks
Standard deviation:
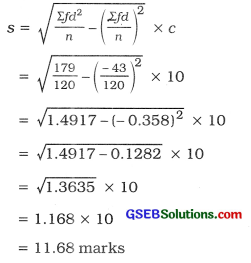
Karl Pearson’s coefficient of skewness:
j = \(\frac{3(\bar{x}-M)}{s}\)
= \(\frac{3(31.42-31.32)}{11.68}\)
= \(\frac{3(0.10)}{11.68}\)
= \(\frac{0.30}{11.68}\)
= 0.026
Type of skewness :
j = 0.026. Therefore, frequency distribution is positively skewed.
Question 4.
The frequency distribution of profits earned by 150 companies during the year 2015-2016 is as follows. Find the coefficient of skewness using an appropriate method and state the type of skewness s

Answer:
The given frequency distribution is of open ended. Therefore, find coefficient of skewness Bowley’s method is an appropriate method.
| Profit (lakh ₹) | No. of companies f | Cumulative frequency cf |
| Less than 10 | 15 | 15 |
| 10-20 | 30 | 45 |
| 20-30 | 50 | 95 |
| 30-40 | 40 | 135 |
| 40 and more | 15 | 150 |
| Total | n = 150 | – |
First Quartile :
Q1 class = class that includes \(\left(\frac{n}{4}\right)\)th observation
= class that includes \(\left(\frac{150}{4}\right)\)th observation
= class that includes 37.5th observation
Referring to column cf, Q1 class = 10 – 20
Now, Q1 = L + \(\frac{\frac{n}{4}-c f}{f}\) × c
Putting L = 10, \(\left(\frac{n}{4}\right)\) = 37.5, cf = 15, f = 30 and c = 10 in the formula,
Q1 = 10 + \(\frac{37.5-15}{30}\) × 10
= 10 + \(\frac{22.5}{3}\)
= 10 + 7.5
= ₹ 17.5 lakh
Median :
M Class = class that includes \(\left(\frac{n}{2}\right)\)th observation
= class that includes \(\left(\frac{150}{2}\right)\)th observation
= class that includes 75th observation Referring to column cf, M class = 20-30
Now, M = L + \(\frac{\frac{n}{2}-c f}{f}\) × c
Putting L = 20, \(\left(\frac{n}{2}\right)\) = 75, cf = 45, f = 50 and c = 10 in the formula,
M = 20 + \(\frac{75-45}{50}\) × 10
= 20 + \(\frac{30}{5}\)
= 20 + 6 = ₹ 26 lakh
Third Quartile:
Q3 class = class that includes 3\(\left(\frac{n}{4}\right)\)th observation
= class that includes 3 (37.5 )th observation
= class that includes 112.5th observation
Referring to column cf, Q3 class = 30-40
Now, Q3 = L + \(\frac{3\left(\frac{n}{4}\right)-c f}{f}\) × c
Putting L = 30, 3\(\left(\frac{n}{4}\right)\) = 112.5, cf = 95, f = 40 and c = 10 in the formula,
9s = 30 + \(\frac{112.5-95}{40}\) × 10
= 30 + 4.38
= ₹ 34.38 lakh
Coefficient of skewness by Bowley’s method:
j = \(\frac{Q_{3}+Q_{1}-2 M}{Q_{3}-Q_{1}}\)
Putting Q3 = 34.38, Q1 = 17.5 and M = 26,
= \(\frac{34.38+17.5-2(26)}{34.38-17.5}\)
= \(\frac{51.88-52}{16.88}\)
= \(\frac{-0.12}{16.88}\)
= -0.007
Type of skewness :
j = – 0.007. Therefore, frequency distribution is negatively skewed.
![]()
Question 5.
The frequency distribution of demand of a certain item is as follows. Find skewness and coefficient of skewness by Karl Pearson’s method.
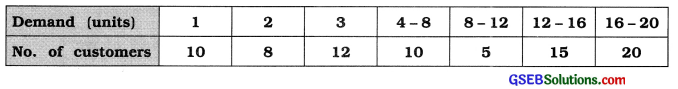
Answer:
The given frequency distribution is of mixed type. Therefore, mode is not defined. Using the formulae Sk = 3 (x̄ – M) and j = \(\frac{3(\bar{x}-\mathrm{M})}{s}\), we will find skewness and coefficient of skewness.
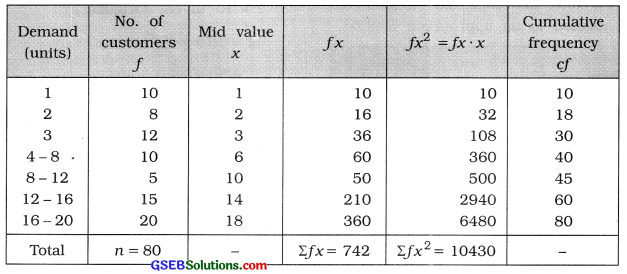
Mean:
x̄ = \(\frac{\sum f x}{n}\)
= \(\frac{742}{80}\) = 9.275 ≈ 9.28 units
Median:
M Class = class that includes \(\left(\frac{n}{2}\right)\)th observation
= class that includes \(\left(\frac{80}{2}\right)\)th observation
= class that includes 40 th observation
Referring to column cf. M class = 4 – 8
Now, M = L + \(\frac{\frac{n}{2}-c f}{f}\) × c
Putting L = 4. \(\left(\frac{n}{2}\right)\) = 40, cf = 30. f = 10 and c = 4 in the formula.
M = 4 + \(\frac{40-30}{10}\) × 4
= 4 + \(\frac{10 \times 4}{10}\)
= 4 + 4 = 8 units
Standard deviation:
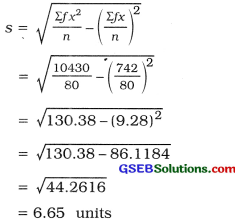
Method of Karl Pearson:
Skewness:
Sk = 3(x̄ – M)
=3(928 – 8)
= 3(1.28)
= 3.84 units
Coefficient of skewness:
j = \(\frac{3(\bar{x}-\mathrm{M})}{s}=\frac{s_{k}}{s}\)
= \(\frac{3.84}{6.66}\)
= 0.58
Question 6.
A sample of 50 screws was taken from the lots of screws produced at a factory to measure the diameter (in mm) of head of each screw and its frequency distribution is as follows. Find Bowley’s coefficient of skewness and interpret it.
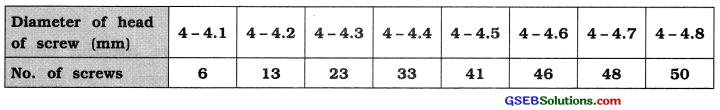
Answer:
The given frequency distribution Is less than type cumulative frequency distribution. The difference between two successive upper boundary points is 0.1. Therefore, class length c = 0.1. Obtaining original frequency distribution we will find coefficient of skewness.
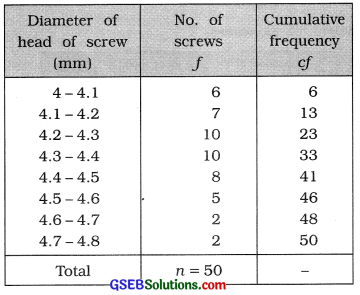
Q1 class = class that Includes \(\left(\frac{n}{4}\right)\)th observation
= class that includes \(\left(\frac{50}{4}\right)\)th observation
= class that Includes 12.5th observation
Referring to column cf. Q1 class = 4.1 – 4.2
Now, Q1 = L + \(\) × c
Putting L – 4.3, \(\left(\frac{n}{4}\right)\) = 25, cf = 23, f = 10 and c = 0.1 in the formula,
Q1 = 4.1 + \(\frac{12.5-6}{7}\) × 0.1
=4.1 + \(\frac{6.5 \times 0.1}{7}\)
= 4.1 + \(\frac{0.65}{7}\)
= 4.1 + 0.09 = 4.19 mm
Third Quartile:
Q3 class = class that Includes 3\(\left(\frac{n}{4}\right)\)th observation
= class that includes 3 (12.5)th observation
= class that Includes 37.5th observation
Referring to column cf. Q3 class = 4.4 — 4.5
Now. Q3 = L + \(\frac{3\left(\frac{n}{4}\right)-c f}{f}\) × c
Putting L = 4.4. 3\(\left(\frac{n}{4}\right)\) = 37.5, cf = 33. f = 8 and c = 0.1 In the formula.
= 4.4 + \(\frac{37.5-33}{8}\) × 0.1
= 4.4 + \(\frac{4.5 \times 0.1}{8}\)
= 4.4 + \(\frac{0.45}{8}\)
= 4.4 + 0.06
= 4.46 mm
Median:
M class = class that includes \(\left(\frac{n}{2}\right)\)th observation
= class that Includes \(\left(\frac{50}{2}\right)\)th observation
= class that includes 25th observation
Referring to column cf, M class = 4.3 – 4.4
Now. M = L + \(\frac{\frac{n}{2}-c f}{f}\) × c
Putting L = 4.3. \(\left(\frac{n}{2}\right)\) = 25. cf = 23. f = 10 and c = 0.1 In the formula.
M =4.3 + \(\frac{25-23}{10}\) × 0.1
= 4.3 + \(\frac{2 \times 0.1}{10}\)
= 4.3 + 0.02
= 4.32 mm
Coefficient of skewness by Bowley’s method:
j = \(\frac{Q_{3}+Q_{1}-2 M}{Q_{3}-Q_{1}}\)
Putting Q3 = 4.46, Q1 = 4.19 and M = 4.32 in the formula.
j = \(\frac{4.46+4.19-2(4.32)}{4.46-4.19}\)
= \(\frac{8.65-8.64}{0.27}\)
= \(\frac{0.01}{0.27}\)
= 0.037
Interpretation:
J = 0.037. Therefore, frequency distribution has positive skewness.
![]()
Question 7.
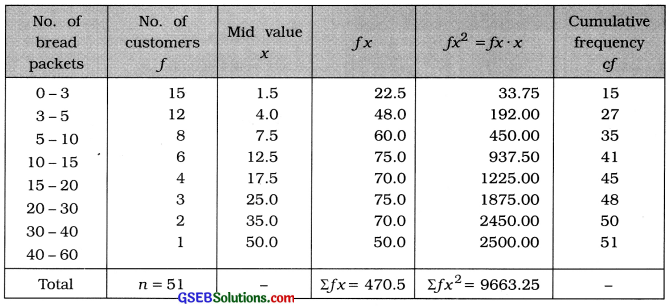
From the following frequency distribution of daily sales of packets of bread from a departmental store, find coefficient of skewness by Karl Pearson’s method and Interpret it:
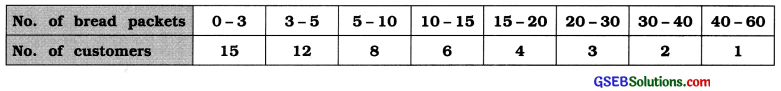
Answer:
In the given frequency distribution Is of unequal class length. Therefore, mode is not defined. Using the formula j = \(\frac{3(\bar{x}-\mathrm{M})}{s}\) we will find coefficient of skewness.
Mean:
x̄ = \(\frac{\Sigma f x}{n}\)
= \(\frac{470.5}{51}\)
= 9.23 packets
Median:
M class = class that includes \(\left(\frac{n}{2}\right)\)th observation
= class that Includes \(\left(\frac{51}{2}\right)\)th observation
= class that Includes 25.5th observatIon
Referring to column cf, M class = 3 – 5
Now. M = L + \(\frac{\frac{n}{2}-c f}{f}\) × c
Putting L = 3, \(\frac{n}{2}\) =25.5, cf = 15, f = 12 and c = 2 in the formula.
M = 3 + \(\frac{25.5-15}{12}\) × 2
= 3 + \(\frac{10.5}{6}\)
= 3 + 1.75
= 4.75 packets
Standard deviation:
Coefficient of skewness by Karl Pearson’s method:
j = \(\frac{3(\bar{x}-M)}{s}\)
= \(\frac{3(9.23-4.75)}{10.21}\)
= \(\frac{3(4.48)}{10.21}\)
= \(\frac{13.44}{10.21}\) = 1.32
Interpretation:
J = 1.32. Therefore, the frequency distribution has positive skewness.
Question 8.
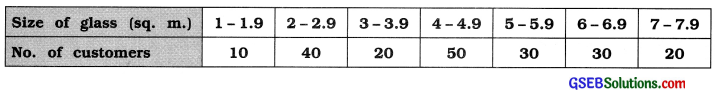
The frequency distribution of sales from a shop selling glass is as follows. Find Bewley’s coefficient of skewness and Interpret it.
Answer:
| Size of glass (sq.m) | No. of Customers f | Cumulative frequency cf |
| 1 – 1.9 | 10 | 10 |
| 2-2.9 | 40 | 50 |
| 3-3.9 | 20 | 70 |
| 4-4.9 | 50 | 120 |
| 5-5.9 | 30 | 150 |
| 6-6.9 | 30 | 180 |
| 7-7.9 | 20 | 200 |
| Total | n = 200 | – |
First Quartile:
Q1 class = class that includes \(\left(\frac{n}{4}\right)\)th observation 1200
= class that includes \(\left(\frac{200}{4}\right)\)th observation
= class that includes 50th observation
Referring to column cf, Q1 class = 2-2.9
[∵differcnce: 2 – 1.9 = 0.1
:. \(\frac{0.1}{2}\) = 0.05 subtraction from lower limit and adding It to upper limit]
In exclusive form Q1 class = 1.95 – 2.95
Now. Q1 = L + \(\frac{\frac{n}{4}-c f}{f}\) × c
Putting L= 1.95. \(\frac{n}{4}\) = 50. cf = 10, f = 40 and c = 1 in the formula,
Q1 = 1.95 + \(\frac{50-10}{40}\) × 1
= 1.95 + \(\frac{40}{40}\)
= 1.95 + 1
= 2.95 sq. m.
Third Quartile:
Q3 class = class that Includes 3\(\left(\frac{n}{4}\right)\)th observation
= class that Includes 3 (50) th observation
= class that Includes 150th observation
Referring to column cf, Q3 class = 5 – 5.9
In exclusive form, Q3 class = 4.95 – 5.95
Now, Q3 = L + \(\frac{3\left(\frac{n}{4}\right)-c f}{f}\) × c
Putting L = 4.95, 3\(\left(\frac{n}{4}\right)\) = 150. cf = 120, f = 30 and c = 1 in the formula,
Q3 = 4.95 + \(\frac{150-120}{30}\) × 1
= 4.95 + \(\frac{30}{30}\)
= 4.95 + 1 = 5.95 sq. m.
Median:
M class = class that includes \(\left(\frac{n}{2}\right)\)th observation
= class that includes \(\left(\frac{200}{2}\right)\)th observation
= class that includes 100th observation
Referring to column cf, M class = 4 – 4.9
In exclusive form, M class = 3.95 – 4.95
Now. M = L + \(\frac{\frac{n}{2}-c f}{f}\) × c
Putting L = 3.95, \(\frac{n}{2}\)= 100, cf = 70.f = 50 and c = 1 in the formula.
M = 3.95 + \(\frac{100-70}{50}\) × 1
= 3.95 + \(\frac{30}{50}\)
= 3.95 + 0.6
= 4.55 sq. m.
Coefficient of skewness Bowley’s method:
j = \(\)
Putting Q3 = 5.95, Q1 = 2.95 and M = 4.55
In the formula.
j = \(\frac{5.95+2.95-2(4.55)}{5.95-2.95}\)
= \(\frac{8.90-9.10}{3}\)
= \(\frac{-0.20}{3}\)
= -0.067
Interpretation:
j = – 0.067. Therefore, frequency distribution has negative skewness.
![]()
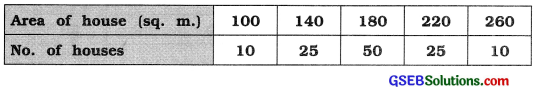
Question 9.
A construction company builds houses with different areas. The frequency distribution of areas of houses is as follows. Find coefficient of skewness by Karl Pearson’s method and interpret it.
Answer:
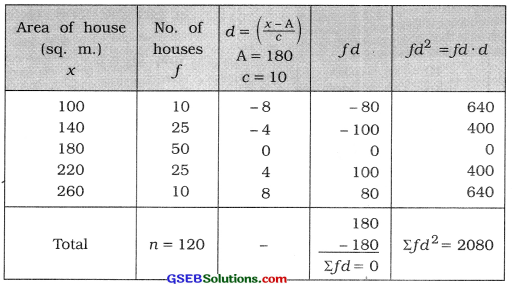
Mean:
x̄ = A + \(\frac{\sum f d}{n}\) × c
= 180 + \(\frac{0}{120}\) × 10
= 180 sq.m
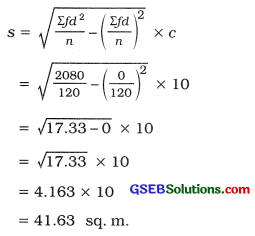
Standard deviation:
Median:
M0 = observation having maximum frequency 50
= 180 sq.m.
Coefficient of skewness by Karl Pearson’s method:
j = \(\frac{\bar{x}-M_{0}}{s}\)
= \(\frac{180-180}{41.63}\)
= \(\frac{0}{41.63}\) = 0
Interpretation : j = 0. Therefore, given frequency distribution is symmetric.
[Note: In the given frequency distribution observations on both sides of mode are uniformly distributed. Therefore, it can be said without calculation that frequency distribution is symmetric.]
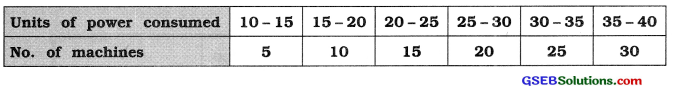
Question 10.
The frequency distribution of units of power consumed in an hour for different machines during a production process of factory is as follows. Find coefficient of skewness by Bowley’s method.
Answer:
| Units of power consumed (units) | No. of machines f | Cumulative frequency cf |
| 10-15 | 5 | 5 |
| 15-20 | 10 | 15 |
| 20-25 | 15 | 30 |
| 25-30 | 20 | 50 |
| 30-35 | 25 | 75 |
| 35-40 | 30 | 105 |
| Total | n = 105 | – |
First Quartile:
Q1 class = class that Includes\(\left(\frac{n}{4}\right)\)th observation
= class that includes \(\left(\frac{105}{4}\right)\)th observatIon ,
= class that Includes 26.25th observation
Referring to column cf. Q1 class = 20 – 25,
Now, Q1 = L + \(\frac{\frac{n}{4}-c f}{f}\) × c
Putting L = 20, = 26.25, cf = 15, f = 15 and c = 5 In the formula,
Q1 = 20 + \(\frac{26.25-15}{15}\) × 5
= 20 + \(\frac{11.25}{3}\)
= 20 + 3.75
= 23.75 units
Third Quartile:
Q3 class = class that includes 3\(\left(\frac{n}{4}\right)\)th observation
= class that Includes 3 (26.25) th observation
= class that includes 78.75th observation
Referring to column cf. Q3 class = 35 – 40
Now. Q3 = L + \(\frac{3\left(\frac{n}{4}\right)-c f}{f}\) × c
Putting L = 35. 3\(\left(\frac{n}{4}\right)\) = 78.75. cf = 75. f = 30 and c = 5 In the formula.
Q3 =35+ \(\frac{78.75-75}{30}\) × 5
= 35 + \(\frac{3.75}{6}\)
= 35 + 0.63
= 35.63 Units
Median:
M class = class that includes \(\left(\frac{n}{2}\right)\)th observation
= class that includes \(\left(\frac{105}{2}\right)\)th observation
= class that includes 52.5th observation
Referring to column cf. M class = 30 – 35
Now. M = L + \(\frac{\frac{n}{2}-c f}{f}\) × c
Putting L = 30, =52.5. cf = 50. f = 25 and c = 5 in the formula.
M =30 + \(\frac{52.5-50}{25}\) × 5
= 30 + \(\frac{2.5}{5}\)
= 30 + 0.5
= 30.5 units
Coefficient of skewness by Bowley’s method:
j = \(\)
Putting Q3 = 35.63. Q1 = 23.75 and M = 30.5 in the formula.
j = \(\frac{35.63+23.75-2(30.5)}{35.63-23.75}\)
= \(\frac{59.38-61}{11.85}\)
= \(\frac{-1.62}{11.88}\)
= -0.14