Gujarat Board Statistics Class 12 GSEB Solutions Part 1 Chapter 3 Linear Regression Ex 3 Textbook Exercise Questions and Answers.
Gujarat Board Textbook Solutions Class 12 Statistics Part 1 Chapter 3 Linear Regression Ex 3
Section A
Answer the following questions by selecting a correct option from the given options:
Question 1.
Which of the following indicates the functional relation between the two variables ?
(a) Correlation
(b) Regression
(c) Mean
(d) Variance
Answer:
(b) Regression

Question 2.
The best fitted line of regression can be obtained by which method ?
(a) Least Square Method
(b) Karl Pearson’s Method
(c) Maximum Square Method
(d) Bowley’s Method
Answer:
(a) Least Square Method
Question 3.
In usual notation, what is byx?
(a) Intercept
(b) Dependent Variable
(c) The approximate change in the value of Y for a unit change in the value of X.
(d) The approximate change in the value of X for a unit change in the value of Y.
Answer:
(c) The approximate change in the value of Y for a unit change in the value of X.
Question 4.
Which of the following is correct ?
(a) byx = r ∙ \(\frac{\mathrm{s}_{x}}{\mathrm{~s}_{y}}\)
(b) byx = r ∙ \(\frac{\mathrm{S}_{y}{ }^{2}}{\mathrm{~S}_{x}{ }^{2}}\)
(c) byx = \(\frac{{Cov}(x, y)}{S_{y}^{2}}\)
(d) byx = r ∙ \(\frac{s_{y}}{s_{x}}\)
Answer:
(d) byx = r ∙ \(\frac{s_{y}}{s_{x}}\)
Question 5.
The regression line always passes which point ?
(a) (x̄, ȳ)
(b) (0, ȳ)
(c) (x̄, 0)
(d) (0, 0)
Answer:
(a) (x̄, ȳ)
Question 6.
What is error e in estimation in case of line of regression of Y on X?
(a) y – ŷ
(b) x̂ – ŷ
(c) x – x̂
(d) ŷ – x̂
Answer:
(a) y – ŷ
Question 7.
Which regression line is used if the sale of a commodity depends on its advertisement cost ?
(a) Regression line of advertisement cost on sale
(b) Regression line of advertisement cost on advertisement cost
(c) Regression line of sales on advertisement cost
(d) Regression line of sales on sales
Answer:
(c) Regression line of sales on advertisement cost
Question 8.
Which of the following is a regression line of Y on X?
(a) ŷ = a + bx + cx2
(b) x̂ = c + by
(c) ŷ = a + bx
(d) ŷ = a + bx2
Answer:
(c) ŷ = a + bx
Question 9.
For which value of the correlation coefficient (r), the regression coefficient becomes zero?
(a) 1
(b) – 1
(c) \(\frac{1}{2}\)
(d) 0
Answer:
(d) 0
Question 10.
What is coefficient of determination in the study of regression for two variables ?
(a) Product of two standard deviations
(b) Square of correlation coefficient
(c) Square of covariance
(d) Product of two variances
Answer:
(b) Square of correlation coefficient
Question 11.
If the regression line is ŷ = 10 + 3x, what is the estimate of Y for X = 20 ?
(a) 13
(b) 60
(c) 70
(d) 203
Answer:
(c) 70
Question 12.
What is the value of byx if the regression line is 2x + 3y – 50 = 0 ?
(a) \(\frac{3}{2}\)
(b) – \(\frac{3}{2}\)
(c) – \(\frac{2}{3}\)
(d) 2
Answer:
(c) – \(\frac{2}{3}\)
Question 13.
The regression line of Y on X is ŷ = 30 – 1.5x. What is the value of ȳ if x̄ = 10?
(a) 28.5
(b) 20
(c) 15
(d) 45
Answer:
(c) 15
Question 14.
If u = \(\frac{x-15}{10}\) and v = \(\frac{y-50}{2}\) and byx = 7.5, what is the value of bvu ?
(a) 7.5
(b) 1.5
(c) 37.5
(d) 150
Answer:
(c) 37.5
Question 15.
If r = 0.8, how much part of the total variation in the dependent variable can be explained by the regression model ?
(a) 80%
(b) 64 %
(c) 36 %
(d) 20 %
Answer:
(b) 64 %
Section B
Answer the following questions in one sentence:
Question 1.
Define : Linear Regression
Answer:
A mathematical or functional relationship between two correlated variables which helps in estimating the value of dependent variable for some given value of independent variable is called Linear Regression.
Question 2.
Define : Regression Coefficient
Answer:
In the regression line of Y on X, ŷ = a + bx, the coefficient ‘b’ of the variable x is called the regression coefficient of the regression line of Y on X.
Question 3.
State the Linear Regression model.
Answer:
The linear regression model is of the form Y = α + βX + u; where α and β are constants, u is error variable.
Question 4.
What is an error in context with a regression line?
Answer:
The difference between the observed value y of the variable Y and the estimated value ŷ of y obtained by the regression model is called an error in context with a regression line. It is denoted by ‘e’. Thus, e = y – ŷ.
Question 5.
Give the name of a method to obtain the best fitted regression line.
Answer:
The method to obtain the best fitted regression line is ‘Least square method’.
Question 6.
The regression coefficient is independent of which transformation?
Answer:
The regression coefficient is independent of change of origin.
Question 7.
The regression coefficient is not independent of which transformation?
Answer:
The regression coefficient is not independent of change of scale.
Question 8.
What is the value of error if a sample point is on the fitted line?
Answer:
The value of error is zero if a sample point is on the fitted line.
Question 9.
Will the regression coefficient change if the values of both the variables are doubled with the help of transformation of scale?
Answer:
If the values of both the variable are doubled then the value of the regression coefficient will not change, because Cx = \(\frac{1}{2}\) and Cy = \(\frac{1}{2}\).
Question 10.
If r = 0.5, Sx = 2, Sy = 4, what is the value of byx?
Answer:
r = 0.5, Sx = 2, Sy = 4
Now, byx = r ∙ \(\frac{\mathrm{S}_{y}}{\mathrm{~S}_{x}}\); putting the values given.
∴ byx = 0.5 × \(\frac{4}{2}\) = 0.5 × 2 = 1
Question 11.
If a regression line is ŷ = 31.5 + 1.85x. estimate Y for X = 10.
Answer:
ŷ = 31.5 + 1.85x
Putting x = 10 in ŷ = 31.5 + 1.85 x, we get
ŷ = 31.5 + 1.85 (10)
= 31.5 + 18.5 = 50
Hence, the estimate of Y for X = 10 obtained is 50.
Question 12.
If Y and X have the relation y = a + bx, where b > 0, then what is the value of r ?
Answer:
y = a + bx; where b > 0, then the value of r is 1.
Question 13.
If y = 5 – 3x is the relation between Y and X then what is the value of r?
Answer:
y = 5 – 3x ∴ b = – 3. Hence the value of r is – 1.
Section C
Answer the following questions as required:
Question 1.
What are the constants a and b in the regression line ŷ = a + bx ? ,
Answer:
In the regression line ŷ = a + bx, a is called the intercept of the regression line of Y on X and b is called the regression coefficient of the regression line of Y on X. It is also called the slope of the regression line of Y on X.
Question 2.
The fitted regression line of Y on X is ŷ = 23.2 – 1.2x and one of the observations used in fitting of the line is (6, 17). Find the error In estimating Y for x = 6.
Answer:
One of the observation on the fitted line ŷ = 23.2 – 1.2x is (6, 17).
∴ observed X = 6 and observed Y = 17
Estimated ŷ for x = 6:
Putting x = 6 in ŷ = 23.2 – 1.2x, we get
ŷ = 23.2 – 1.2 (6)
= 23.2 – 7.2 = 16
Now, error (e) = y – ŷ
Putting y = 17 and ŷ = 16, we get
e = 17 – 16 = 1
Hence, the error in estimating Y for X = 6 obtained is 1.
Question 3.
If x̄ = 30, ȳ = 20 and b = 0.6, find the intercept of the regression line of Y on X and write equation of the line.
Answer:
X̄ = 30, ȳ = 20, b = 0.6
Intercept a = ȳ – bx̄
∴ a = 20 – 0.6(30) = 20 – 18 = 2
Putting a = 2 and b = 0.6 in ŷ = a + bx, the equation of the regression line obtained is ŷ = 2 + 0.6x.
Question 4.
Interpret byx = 5.
Answer:
byx = 5 means a unit increase in the value of variable X results in estimated increase of 5 units in the value of variable Y.
Question 5.
If b = 1.5, r = 0.8 and standard deviation of X is 1.6, find the standard deviation of Y.
Answer:
b = 1.5, r = 0.8, Sx = 1.6, Sy = ?
Now, b = r ∙ \(\frac{\mathrm{S}_{y}}{\mathrm{~S}_{x}}\)
∴ 1.5 = 0.8 × \(\frac{\mathrm{S}_{y}}{1.6}\)
∴ 1.5 = \(\frac{s_{y}}{2}\)
∴ 1.5 = 1.5 × 2 = 3
Question 6.
If the regression coefficient of the regression line of Y on X is 0.6 and the standard deviations of X and Y are 5 and 3 respectively, find the coefficient of determination.
Answer:
b = 0.6; Sx = 5, Sy = 3, r = ?
Now, b = r ∙ \(\frac{\mathrm{s}_{y}}{\mathrm{~S}_{x}}\)
∴ 0.6 = r ∙ \(\frac{3}{5}\)
∴ 0.6 = 0.6 r
∴ r = \(\frac{0.6}{0.6}\) = 1
Coefficient of determination R = (r)2 = (1)2 = 1
Question 7.
If the regression line of Y on X is ŷ = 35 + 2x and Cov (x, y) = 50, find the standard deviation of X.
Answer:
ŷ = 35 + 2x ∴ b = 2, Cov (x, y) = 50,
Sx = ?
Now, b = \(\frac{{Cov}(x, y)}{\mathrm{S}_{x}^{2}}\)
∴ 2 = \(\frac{50}{\mathrm{~s}_{x}^{2}}\)
∴ 2Sx2 = 50
∴ Sx2 = \(\frac{50}{2}\) = 25
∴ Sx = 5
Hence, Standard deviation of X obtained is 5.
Question 8.
For the regression line given in the previous question (7), if the value of Y is to be increased by 10 units, how many units should be increased in the value of X?
Answer:
ŷ = 35 + 2x̄ is given.
Here, b = 2
Hence, if the value of Y is to be increased by 10 units, then \(\frac{10}{2}\) = 5 units should be increased in the value of X.
Question 9.
If x̄ = 10, ȳ = 25, Σ(x – 10) (y – 25) = 120 and Σ(x – 10)2 = 100, find the values of a and b for the regression line of Y on X.
Answer:
x̄ = 10; ȳ = 25; .
Σ(x – 10) (y – 25) = 120, Σ(x – 10)2 = 100
x̄ = 10 and ȳ = 25.
∴ Σ(x – 10) (y – 25) = Σ(x – x̄) (y – ȳ) = 120 and Σ(x – 10)2 = Σ(x – x̄)2 = 10
Now, b = \(\frac{\Sigma(x-\bar{x})(y-\bar{y})}{\Sigma(x-\bar{x})^{2}}\) = \(\frac{120}{100}\) = 1.2
a = ȳ – bx̄
Putting x̄ = 10, ȳ = 25 and b = 1.2, we get
a = 25 – 1.2 (10) = 25 – 12 = 13
Hence, a and b obtained for the regression line of Y on X obtained are 13 and 1.2 respectively.
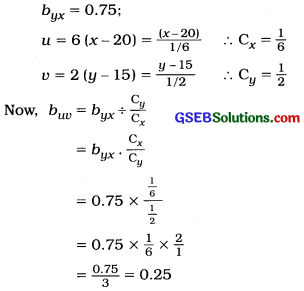
Question 10.
If byx = 0.75, u = 6 (x – 20) and v = 2 (y – 15) for the data in the study of a regression line then find the value of bvu.
Answer:
Section D
Answer the following questions as required:
Question 1.
Explain the statement, “There is a cause and effect relationship between two variables” by giving a suitable example. Also define independent variable and dependent variable.
Answer:
When due to relationship between two random variables, changes in the values of one variable results in the changes in the values of the other variable and it is possible to estimate what type of changes and how much changes occur in the values of one variable, due to changes in the values of other variable and if we get the estimate of the value of one variable for the given value of another variable then such relationship between two variables is called cause and effect relationship.
For example, knowing the relation between income and expenditure, we can estimate the increase in expenditure due to certain increase in the income. Also it is possible to get the estimate of expenditure for a fixed income.
Here, income is a cause variable and expenditure is an effect variable. Hence, there is cause and effect relationship between income and expenditure.
Independent Variable: Out of two related variables a variable in the form of cause is called an independent variable. It is denoted by symbol X.
Dependent Variable: Out of two related variables, a variable in the form of an effect is called a dependent variable. It is denoted by symbol Y.
Question 2.
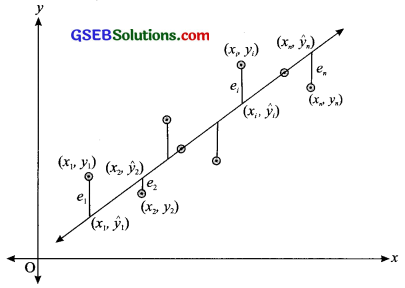
Explain the method of scatter diagram for fitting a line of regression and state its limitation.
Answer:
Suppose n observations of a data are (x1, y1), (x2, y2), …….. (xn, yn) based on a sample drawn from a bivariate population. From this data we have to fit the line of regression of Y on X. First of all, we will draw scatter diagram by plotting the n pairs of observations (x1, y1), (x2, y2), …….. (xn, yn). We will draw a line in such a way that it is close to almost all the points of the scatter diagram and gives the best estimate of relationship between Y and X.
Such line of best fit is called the regression line of, Y on X. We can find the equation of the regression line by choosing any two points on the line. This equation is called the regression line. This method to fit the line of regression is easy and quick and does not require any computation.
Limitations:
- The regression line obtained by this method does not give the best estimate of relation between Y and X.
- In this method, from the same data, different persons can select different points and get the different regression lines. Hence, using them the conclusions derived are different.
- This method is not objective but it is rather subjective in sense.
Question 3.
Explain the method of least square for fitting a regression line.
Answer:
The best fitted regression line of Y on X can be obtained by this method. Suppose n ordered pairs of sample observations on two correlated variables X and Y are (x1, y1), (x2, y2), …, (xn, yn). To understand the least square method we draw the scatter diagram for this data.
If the equation of best fitted line showing the linear regression between Y and X is ŷ = a + bx then the values of constants a and b can be obtained by least square method as follows:
Suppose ŷ1, ŷ2, ………, ŷn are the estimated values for the values y1, y2, ………. yn of Y obtained by the equation of line Y corresponding to the values x1, x2, ………., xn of variable X.
Now, for a given value x1 of x, the corresponding to the value y of y1 the estimated value ŷ of y will be ŷ = a + bx1.
The values of constants a and b of the fitted line ŷ = a + bx are obtained by least square method in such a way so that the sum of squares of errors Σei2 becomes minimum, where (e = y – ŷ). Thus, Σe2 = Σ(y – ŷ)2 = Σ(y – a – bx)2 becomes minimum.
The line ŷ = a + bx obtained passes through close to most of the points on scatter diagram. While obtaining the regression line, the sum of squares of errors is minimised, therefore it is called method of least square.
Question 4.
State the utility of regression.
Answer:
The utility of regression can be described as follows :
- We can know the functional relationship between two correlated variables.
- We can estimate the unknown value of Y, for a given value of independent value of X.
- We can find the estimated change in Y, per unit change in X with the help of regression.
- We can determine the error occured in finding the estimated value of dependent variable by using the regression line.
- It is useful for economists, planners, businessmen, administrators, researchers, etc.
Question 5.
State properties of regression coefficient. Also state the point through which a regression line always passes.
Answer:
The properties of regression coefficient are as follows :
- The signs of correlation coefficient r and regression coefficient b are same.
- Value of regression coefficient b is independent of change of origin but not of scale.
- From regression coefficient the estimated change in the value of Y, per unit change in the value of X can be known.
- The value of b can be less than 1 or greater than 1.
- The regression coefficient is a relative measure.
- Sign of ‘b’ depends on the sign of Cov(x, y).
- If b > 0, a unit increase in X, implies an estimated increase of b units in Y.
- If b < 0, a unit increase in X, implies an estimated decrease of b units in Y.
Question 6.
Explain: coefficient of determination
Answer:
The square of correlation coefficient between the observed value y of the dependent variable Y and the corresponding estimated value ŷ of y by the regression line ŷ = a + bx is called the coefficient of determination. It Is denoted by R2.
Thus, R2 = [Coy (y, ŷ)]2
= [Cov(y, a + bx)]2
= [Cov(y, x)]2
= r2
Uses:
(i) To determine the reliability of estimates obtained from the regression lines:
- If R2 = 1, estimates obtained on the basis of regression line are 100 % reliable. There is perfect linear correlation between the variable Y and X.
- If R2 = 0 estimates obtained on the basis of regression line are not reliable. There is lack of linear correlation between the variables Y and X.
(ii) For the interpretation regarding the assumption of linear regression between two random variables X and Y:
- If the value of R2 obtained is close to 1 (i.e., 0.5 ≤ R2 < 1), then it can be said that correlation between variables Y and X is close to the perfect linear correlation and hence it is said that the assumption of linear regression between variables X and Y is proper.
- If the value of R2 obtained is close to zero (0) (i.e., 0 ≤ R2 < 0.5) then it can be said that the correlation between variables Y and X is far from the perfect linear correlation and hence it is said that the assumption of linear regression between variables X and Y is not proper.
Question 7.
State precautions which are necessary while using the regression.
Answer:
The following precautions are necessary while using the regression:
- We should make the use of the estimates obtained only after examining the assumption of linear regression by coefficient of determination R2.
- The regression relation obtained by the scatter diagram or by the least squares should not be used for the values which are very far from the given values of independent variable.
- If the correlation between Y and X is found near to perfect linear correlation then only the conclusions drawn from the regression line should be used.
- If the linear regression model is not found proper, then in such a case only after obtaining the proper linear regression model using statistical methods, we should make use of estimates and conclusions from the regression model.
Question 8.
For two related variables X and Y, Σ(x – x̄)2 = 80, Σ(x – X̄) (y – ȳ) = 60, x̄ = 8, ȳ = 10. Obtain the regression line of Y on X.
Answer:
Here, Σ(x – x̄)2 = 80; Σ(x – x̄) (y – ȳ) = 60;
x̄ = 8; ȳ = 10
Now, b = \(\frac{\Sigma(x-\bar{x})(y-\bar{y})}{\Sigma(x-\bar{x})^{2}}\)
∴ b = \(\frac{60}{80}\)
= 0.75
a = ȳ – bx̄
∴ a = 10 – 0.75 (8)
= 10 – 6
= 4
The regression line of Y on X is ŷ = a + bx.
Putting a = 4 and b = 0.75 in ŷ = a + bx the regression line of Y on X obtained is ŷ = 4 + 0.75x.
Question 9.
If x̄ = 30, ȳ = 50, r = 0.8 and the standard deviations of X and Y are 2 and 5 respectively, obtain the regression line of Y on X.
Answer:
Here, x̄ = 30; ȳ = 50; r = 0.8; Sx = 2 and Sy = 5
Now, b = r ∙ \(\frac{\mathrm{S}_{y}}{\mathrm{~S}_{x}}\)
∴ b = 0.8 × \(\frac{5}{2}\)
= 2
a = ȳ – bx̄
∴ a = 50 – 2(30)
= 50 – 60
= – 10
Regression line of Y on X is ŷ = a + bx
Putting a = – 10; b = 2 in ŷ = a + bx, the regression line of Y on X obtained is ŷ = – 10 + 2x.
Question 10.
If the regression line of Y on X is ŷ = 11 + 3x and Sx: Sy = 3 : 10, find the coefficient of determination.
Answer:
ŷ = 11 + 3x ∴ b = 3
Sx : Sy = 3 : 10,
∴ Sx = 3, Sy = 10.
Now, b = r ∙ \(\frac{\mathrm{S}_{y}}{\mathrm{~S}_{x}}\)
∴ 3 = r × \(\frac{10}{3}\)
∴ r = 3 × \(\frac{3}{10}\) = \(\frac{9}{10}\) = 0.9
Now, coefficient of determination
R2 = (r)2
∴ R2 = (0.9)2
= 0.81
Question 11.
In usual notations, n = 7; Σu = 2; Σv = 25; Σu2 = 160 and Σuv = 409. Obtain the regression coefficient of a regression line of Y on X and interpret it.
Answer:
n = 7, Σu = 2, Σv = 25, Σu2 = 160 and Σuv = 409
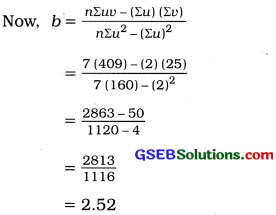
Interpretation: b = 2.52. Hence it can be said that a unit Increase in the value of the variable X implies an estimated Increase of 2.52 units in the value of variable Y.
Question 12.
If byx = 0.8, then find the value of bvu for the following u and v :
(i) u = x – 105 and v = y – 90
Answer:
u = x – 105 = x – A
and v = y – 90 = y – B
∴ bvu = byx = 0.8
(∵ b is independent of change of origin).
(ii) u = \(\frac{x-1400}{100}\) and v = \(\frac{y-750}{50}\)
Answer:
u = \(\frac{x-1400}{100}\) = \(\frac{x-\mathrm{A}}{\mathrm{C}_{x}}\) ∴Cx = 100
and v = \(\frac{y-750}{50}\) = \(\frac{y-\mathrm{B}}{\mathrm{C}_{y}}\) ∴ Cy = 50
Now, byx = bvu ∙ \(\frac{\mathrm{C}_{y}}{\mathrm{C}_{x}}\)
∴ bvu = byx ∙ \(\frac{\mathrm{C}_{x}}{\mathrm{C}_{y}}\)
= 0.8 × \(\frac{100}{50}\) = 1.6
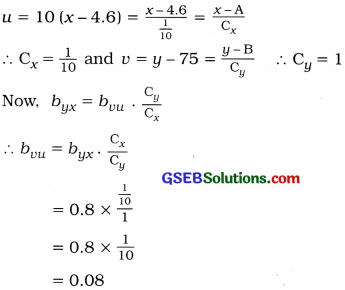
(iii) u = 10 (x – 4.6) and v = y – 75
Answer:
Question 13.
The following results are obtained for a bivariate data.
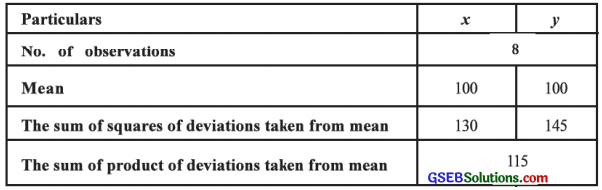
Obtain the regression line of Y on X.
Answer:
Here, n = 8; x̄ = 100; ȳ = 100;
Σ(x – x̄)2 = 130; Σ(y – ȳ)2 = 145 and
Σ(x – x̄) (y – ȳ) =115 are given.
Now, b = \(\frac{\Sigma(x-\bar{x})(y-\bar{y})}{\Sigma(x-\bar{x})^{2}}\)
∴ b = \(\frac{115}{130}\)
= 0.88
a = ȳ – bx̄
∴ a = 100 – 0.88 (100)
= 100 – 88
= 12
Regression line of Y on X is ŷ = a + bx
Putting a = 12 and b = 0.88 in ŷ = a + bx, the regression line of Y on X obtained is ŷ = 12 + 0.88x.
Section E
Solve the following:
Question 1.
A manager of an I.T. company has collected the following information regarding the years of job and monthly income of seven marketing executives;
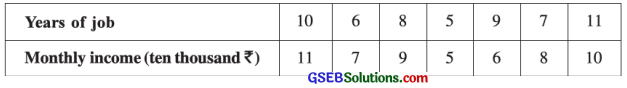
Obtain the regression line of the monthly income on the years of job of the marketing executives.
Answer:
Here, n = 7; X = Years of job and Y = Monthly income
Now, x̄ = \(\frac{\Sigma x}{n}\) = \(\frac{56}{7}\) = 8 and ȳ = \(\frac{\Sigma y}{n}\) = \(\frac{56}{7}\) = 8
We obtain the regression line of monthly income (Y) on the years of job (X), ŷ = a + bx.
The table for calculating the values of a and b is prepared as follows:
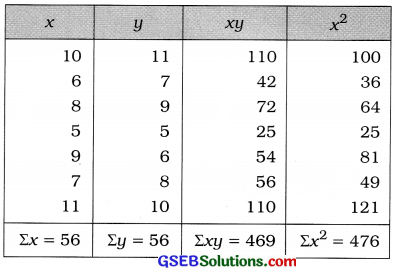
b = \(\frac{n \Sigma x y-(\Sigma x)(\Sigma y)}{n \Sigma x^{2}-(\Sigma x)^{2}}\)
Putting n = 7; Σxy = 469; Σx2 = 476; Σx = 56 and Σy = 56 in the formula,
b = \(\frac{7(469)-(56)(56)}{7(476)-(56)^{2}}\)
= \(\frac{3283-3136}{3332-3136}\)
= \(\frac{147}{196}\)
= 0.75
a = ȳ – bx̄
Putting ȳ = 8; x̄ = 8 and b = 0.75, we get
a = 8 – 0.75 (8)
=8 – 6 = 2
Regression line of monthly income (Y) on the years of job (X) :
Putting a = 2 and b = 0.75 in ŷ = a + bx, we get ŷ = 2 + 0.75x.
Question 2.
The information collected regarding price (in ₹) of a commodity and its supply (in hundred units) is as follows:
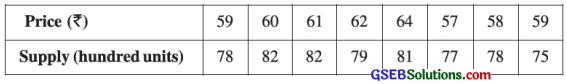
Obtain the regression line of the supply on the price.
Answer:
Here, n = 8; X = Price and Y = Supply
Now, x̄ = \(\frac{\Sigma x}{n}\) = \(\frac{480}{8}\) = 60; ȳ = \(\frac{\Sigma y}{n}\) = \(\frac{632}{8}\) =79
We obtain the regression line of supply (Y) on the price (X),
ŷ = a + bx
x̄ and ȳ are integers. So the table for calculating the values of a and b is prepared as follows:
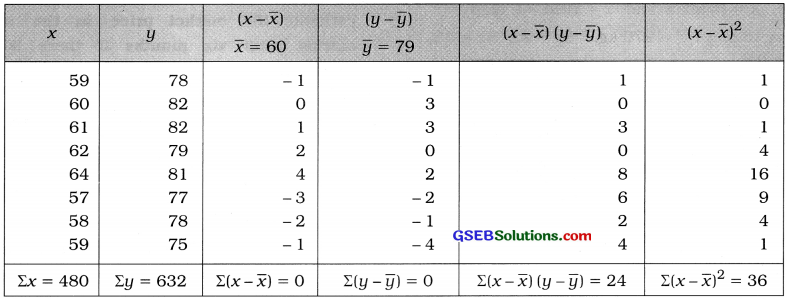
b = \(\frac{\Sigma(x-\bar{x})(y-\bar{y})}{\Sigma(x-\bar{x})^{2}}\)
Putting Σ(x – x̄) (y – ȳ) = 24 and Σ(x – x̄)2 = 36 in the formula,
b = \(\frac{24}{36}\)
= 0.67
a = ȳ – bx̄
Putting ȳ = 79; x̄ = 60 and b = 0.67, we get
a = 79 – 0.67 (60)
= 79 – 40.2 = 38.8
Regression line of Y on X:
Putting a = 38.8 and b = 0.67 in ŷ = a + bx, we get
ŷ = 38.8 + 0.67x
Hence, the regression line of supply (Y) on price (X) obtained is ŷ = 38.8 + 0.67x
Question 3.
The following information is obtained for monthly advertisement cost and the sales of the last year for a company providing online shopping:
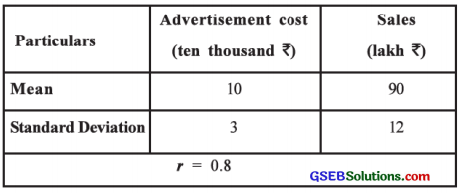
Obtain the regression line of the sales on the advertisement cost.
Answer:
Here, X = Advertisement cost and Y = Sales
∴ x̄ = 10; ȳ = 90; Sx = 3; Sy = 12; r = 0.8
Now, b = r ∙ \(\frac{\mathrm{S}_{y}}{\mathrm{~S}_{x}}\)
∴ b = 0.8 × \(\frac{12}{3}\)
= 3.2
a = ȳ – bx̄
a = 90 – 3.2 (10)
= 90 – 32
= 58
The regression line of the sales (Y) on the advertisement cost (X):
Putting a = 58 and b = 3.2, in ŷ = a + bx, we get ŷ = 58 + 3.2x.
Question 4.
The following results are obtained from the information of average rain and yield of a crop per acre in the last ten years of an arid region:
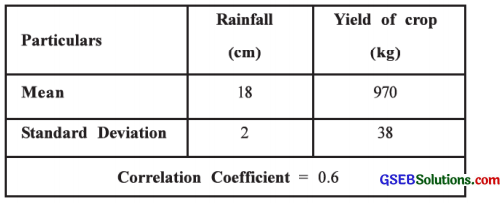
Estimate the yield of the crop if it rains 20 cms.
Answer:
Here, X = Rainfall and Y = Yield of crop
∴ x̄ = 18 cm; ȳ = 970 kg, Sx = 2, Sy = 38, r = 0.6.
Now, b = r ∙ \(\frac{\mathrm{S}_{y}}{\mathrm{~S}_{x}}\)
∴ b = 0.6 × \(\frac{38}{2}\)
= 11.4
a = ȳ – bx̄
∴ a = 970 – 11.4 (18)
= 970 – 205.2
= 764.8
The regression line of yield of crop (Y) on rainfall (X) :
Putting a = 764.8 and b = 11.4 in ŷ = a + bx, we get
ŷ = 764.8 + 11.4x
Estimate of yield of crop (Y) if rainfall X = 20 cms :
Putting x = 20 in ŷ = 764.8 + 11.4x, we get
ŷ = 764.8 + 11.4 (20)
= 764.8 + 228
= 992.8
Hence, the estimate of yield of crop obtained is 992.8 kg.
Question 5.
The information of investment (in lakh ₹) and Its market price (in lakh ₹) after six months in share market in the last seven years for a Mutual Fund Company is obtained as follows:
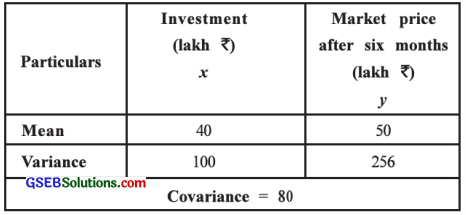
Obtain the regression line of Y on X and estimate the market price in the share market after six months if there is an investment of ₹ 45 lakh in a year.
Answer:
Here, X = Investment and Y = Market price after six months.
∴ x̄ = 40; ȳ = 50; Sx2 = 100; Sy2 = 256
Cov (x, y) = 80
Now, b = \(\frac{{Cov}(x, y)}{\mathrm{S}_{x}^{2}}\)
∴ b = \(\frac{80}{100}\) = 0.8
a = ȳ – bx̄
∴ a = 50 – 0.8 (40)
= 50 – 32 = 18
The regression line of Y on X:
Putting a = 18 and b = 0.8, in ŷ = a + bx, we get
ŷ = 18 + 0.8x
Estimate of market price (Y) for investment X = ₹ 45 lakh :
Putting x = 45 in ŷ = 18 + 0.8x, we get
ŷ = 18 + 0.8 (45)
= 18 + 36 = 54
Hence, the estimate of market price in the share market after six months obtained is ₹ 54 lakh.
Section F
Solve the following:
Question 1.
Obtain the regression line of the demand on the price using the following information collected for the demand and the price of a commodity. Estimate the demand of the commodity if price is ₹ 40.
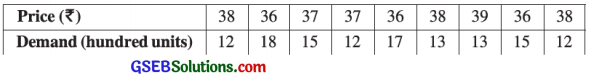
Answer:
Here, n = 9; X = Price and Y = Demand
Now, x̄ = \(\frac{\Sigma x}{n}\) = \(\frac{335}{9}\) = 37.22; ȳ = \(\frac{\Sigma y}{n}\) = \(\frac{127}{9}\) = 14.11
We have to obtain the regression line ŷ = a + bx of demand (Y) on price (X).
We calculate the values of a and b by shortcut method taking new variables u = x – A, A = 30, v = y – B, B = 15.
The table for calculation is prepared as follows:
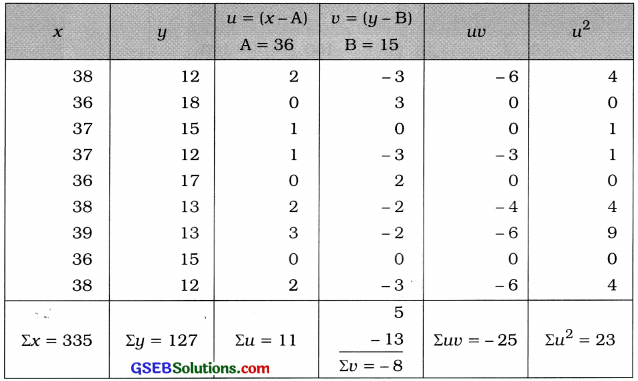
b = \(\frac{n \Sigma u v-(\Sigma u)(\Sigma v)}{n \Sigma u^{2}-(\Sigma u)^{2}}\)
Putting n = 9; Σuv = – 25: Σu = 11; Σv = – 8 and Σu2 = 23 in the formula,
b = \(\frac{9(-25)-(11)(-8)}{9(23)-(11)^{2}}\)
= \(\frac{-225+88}{207-121}\)
= \(\frac{-137}{86}\)
= – 1.59
a = ȳ – bx̄
Putting ȳ = 14.11; x̄ = 37.22 and b = – 1.59, we get
a = 14.11 – (- 1.59) (37.22)
= 14.11 + 59.18
= 73.29
Regression line of demand (Y) on price (X) :
Putting a = 73.29 and b = – 1.59 in ŷ = a + bx, we get
ŷ = 73.29 – 1.59x
Estimate of demand (Y) when price (X) = ₹ 40 :
Putting x = 40 in ŷ = 73.29 – 1.59x, we get
ŷ = 73.29 – 1.59 (40)
= 73.29 – 63.6
= 9.69
Hence, the estimate of demand obtained is ŷ = 9.69 (’00 units)
Question 2.
The information regarding the experience (in years) of eight workers on a machine and their performance ratings based on the nondefective units they manufactured in every 100 units is as follows:
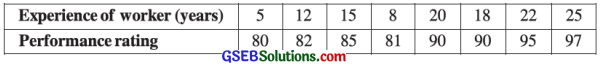
Obtain the regression line of the performance rating on the experience and estimate the performance rating if a worker has an experience of 17 years.
Answer:
Here, n = 8; X = Experience of worker and Y = Performance rating
Now, x̄ = \(\frac{\Sigma x}{n}\) = \(\frac{125}{8}\) = 15.63; ȳ = \(\frac{\Sigma y}{n}\) = \(\frac{700}{8}\) = 87.5
We obtain the regressoin line ŷ = a + bx of performance rating (Y) on the experience of workers (X). To make the calculation of a and b simple, we take new variables u = x – A, A = 15 and v = y – B, B = 90.
The table for calculation is prepared as follows:
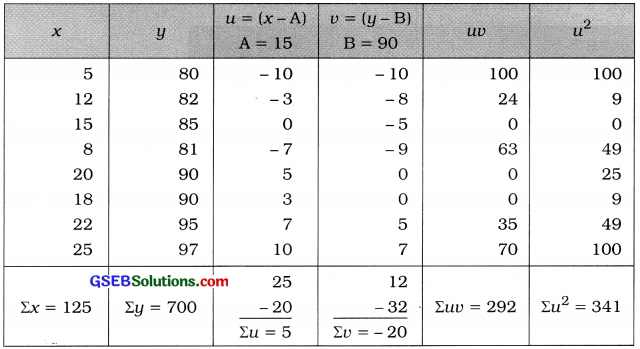
b = \(\frac{n \Sigma u v-(\Sigma u)(\Sigma v)}{n \Sigma u^{2}-(\Sigma u)^{2}}\)
Putting n = 8; Σuv = 292; Σu = 5; Σu = – 20 and Σu2 = 341 in the formula,
b = \(\frac{8(292)-(5)(-20)}{8(341)-(5)^{2}}\)
= \(\frac{2336+100}{2728-25}\)
= \(\frac{2436}{2703}\)
= 0.9
a = ȳ – bx̄
Putting ȳ = 87.5; x̄ = 15.63; b = 0.9, we get
a = 87.5 – 0.9 (15.63)
= 87.5 – 14.07
= 73.43
Regression line of performance rating (Y) on experience of worker (X):
Putting a = 73.43; b = 0.9 in ŷ = a + bx, we get ŷ = 73.43 + 0.9x
Estimate of performance rating Y when X = 17 year :
Putting x = 17 in ŷ = 73.43 + 0.9x, we get
ŷ = 73.43 + 0.9 (17)
= 73.43 + 15.3
= 88.73
Hence, the estimate of performance rating (Y) obtained is ŷ = 88.73.
Question 3.
The information regarding daily income (in ₹) and expenditure (in ₹) of five labour families earning by daily work:
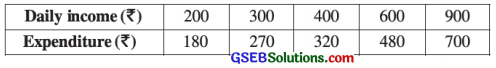
Obtain the regression line of the expenditure on the daily income. Estimate the expenditure of a family having daily income of ₹ 500.
Answer:
Here, n = 5; X = Daily income and Y = Expenditure.
Now, x̄ = \(\frac{\Sigma x}{n}\) = \(\frac{2400}{5}\) = 480; ȳ = \(\frac{\Sigma y}{n}\) = \(\frac{1950}{5}\) = 390;
We obtain the regression line ŷ = a + bx of expenditure (Y) on daily income (X).
To make the calculation of values a and b simple, we take new variables u = \(\frac{x-\mathrm{A}}{\mathrm{C}_{x}}\), A = 400, Cx = 100 and v = \(\frac{y-\mathrm{B}}{\mathrm{C}_{y}}\), B = 320, CY = 10.
The table for calculation is prepared as follows:
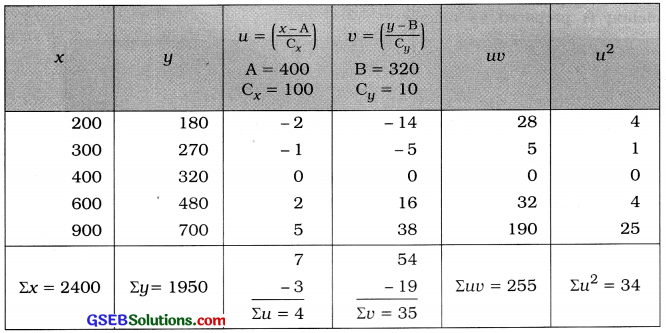
b = \(\frac{n \Sigma u v-(\Sigma u)(\Sigma v)}{n \Sigma u^{2}-(\Sigma u)^{2}} \times \frac{\mathrm{C}_{y}}{\mathrm{C}_{x}}\)
Putting n = 5; Σuv = 255; Σu = 4; Σv = 35; Σu2 = 34; Cx = 100 and Cy = 10 in the formula,
b = \(\frac{5(255)-(4)(35)}{5(34)-(4)^{2}} \times \frac{10}{100}\)
= \(\frac{1275-140}{170-16} \times \frac{1}{10}\)
= \(\frac{1275-140}{170-16} \times \frac{1}{10}\)
= \(\frac{1135}{1540}\)
= 0.74
a = ȳ – bx̄
Putting ȳ = 390; x̄ = 480 and b = 0.74, we get
a = 390 – 0.74 (480)
= 390 – 355.2
= 34.8
Regression line of expenditure (Y) on daily income (X) :
Putting a = 34.8; b = 0.74 in y = a + bx, we get
ŷ = 34.8 + 0.74x
Estimate of expenditure Y when X = ? 500 :
Putting x = 500 in ŷ = 34.8 + 0.74x, we get
ŷ = 34.8 + 0.74(500)
= 34.8 + 370 = 404.8
Hence, the estimate of expenditure obtained is y = ₹ 404.8.
Question 4.
The following information is collected by a firm to know the effect of an advertisement campaign :
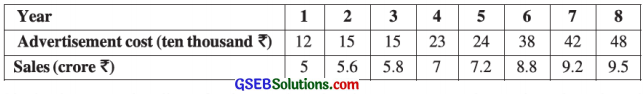
Obtain the regression line of sales on the advertisement cost. Estimate the sales when the advertisement cost is ₹ 5,00,000.
Answer:
Here, n = 8; X = Advertisement cost and Y = Sales
Now, x̄ = \(\frac{\Sigma x}{n}\) = \(\frac{217}{8}\) = 27.13; ȳ = \(\frac{\Sigma y}{n}\) = \(\frac{58.1}{8}\) = 7.26
We obtain the regression line ŷ = a + bx of sales (Y) on the advertisement cost (X).
To make the calculation of values a and b simple, we obtain the new variable u = (x – A), A = 24 and v = \(\frac{y-\mathrm{B}}{\mathrm{C}_{y}}\), B = 7, Cy = 0.1
The table for calculation is prepared as follows:
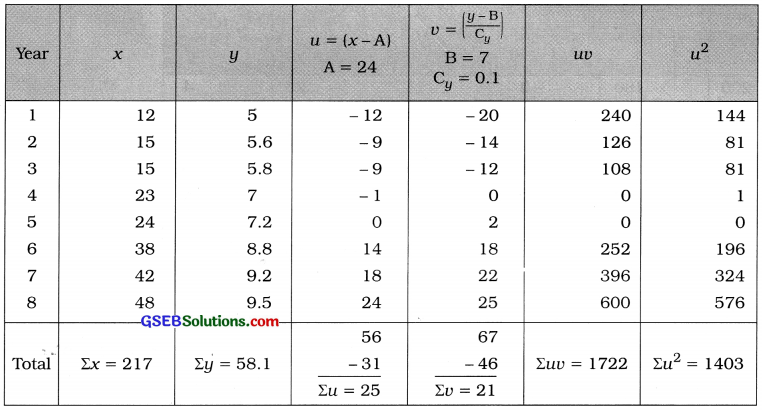
b = \(\frac{n \Sigma u v-(\Sigma u)(\Sigma v)}{n \Sigma u^{2}-(\Sigma u)^{2}} \times \frac{\mathrm{C}_{y}}{\mathrm{C}_{x}}\)
Putting n = 8; Σuv = 1722; Σu = 25; Σv = 21; Σu2 = 1403; Cy = 0.1 and Cx = 1 in the formula,
b = \(\frac{8(1722)-(25)(21)}{8(1403)-(25)^{2}} \times \frac{0.1}{1}\)
= \(\frac{13776-525}{11224-625} \times \frac{0.1}{1}\)
= \(\frac{13251 \times 0.1}{10599}\)
= \(\frac{1325.1}{10599}\)
= 0.13
a = ȳ – bx̄
Putting ȳ = 7.26; x̄ = 27.13 and b = 0.13, we get
a = 7.26 – 0.13 (27.13)
= 7.26 – 3.53 = 3.73
Regression line of sales (Y) on advertisement cost (X):
Putting a = 3.73 and b = 0.13 in ŷ = a + bx, we get
ŷ = 3.73 + 0.13x
Estimate of sales (Y) when, X = ₹ 5,00,000 (i.e., 50 ten thousand) :
Putting x = 50 in ŷ = 3.73 + 0.13x, we get
ŷ = 3.73 + 0.13 (50)
= 3.73 + 6.5
= 10.23
Hence, the estimate of sales Y obtained is ŷ = ₹ 10.23 crore.
Question 5.
The information of eight construction companies regarding the number of contracts received in a year and the annual profit is as follows:
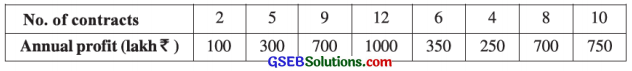
Obtain the regression line of the annual profit on the number of contracts. Verify the reliability of the regression model.
Answer:
Here, n = 8; X = No. of contracts and Y = Annual profit.
Now, x̄ = \(\frac{\Sigma x}{n}\) = \(\frac{56}{8}\) = 7; ȳ = \(\frac{\Sigma y}{n}\) = \(\frac{4150}{8}\) = 518.75
We obtain the regression line ŷ = a + bx of annual profit (Y) on number of contracts (X).
To make the calculation of values of a and b simple, we obtain new variables u = x – A, A = 8 and v = \(\left(\frac{y-\mathrm{B}}{\mathrm{C}_{y}}\right)\), B = 700, Cy = 50.
The table for calculation is prepared as follows:
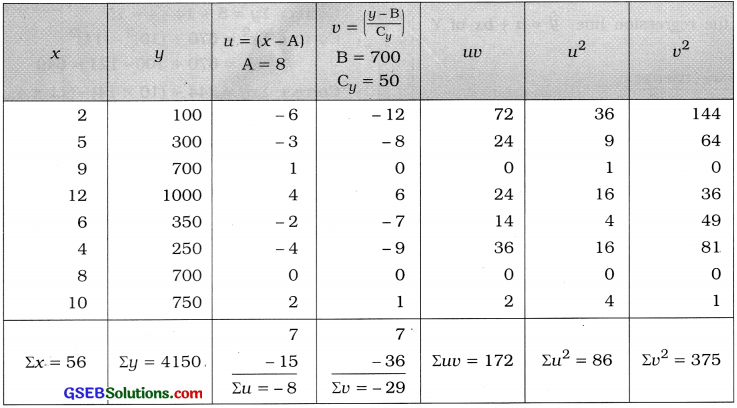
b = \(\frac{n \Sigma u v-(\Sigma u)(\Sigma v)}{n \Sigma u^{2}-(\Sigma u)^{2}} \times \frac{\mathrm{C}_{y}}{\mathrm{C}_{x}}\)
Putting n = 8; Σuv = 172; Σu = – 8; Σv = – 29; Σu2 = 86; Cy = 50 and Cx = 1 in the formula,
b = \(\frac{8(172)-(-8)(-29)}{8(86)-(-8)^{2}} \times \frac{50}{1}\)
= \(\frac{1376-232}{688-64} \times \frac{50}{1}\)
= \(\frac{1144 \times 50}{624}\)
= \(\frac{57200}{624}\)
= 91.67
a = ȳ – bx̄
Putting ȳ = 518.75; x̄ = 7 and b = 91.67, we get
a = 518.75 – 91.67 (7)
= 518.75 – 641.69
= – 122.94
Regression line of annual profit (Y) on number of contracts (X) :
Putting a = – 122.94 and b = 91.67 in
ŷ = a + bx, we get
ŷ = – 122.94 + 91.67
Coefficient of determination :
Now, R2 = r2 = \(\left[\frac{n \Sigma u v-(\Sigma u)(\Sigma v)}{\sqrt{n \Sigma u^{2}-(\Sigma u)^{2}} \cdot \sqrt{n \Sigma v^{2}-(\Sigma v)^{2}}}\right]^{2}\)
Putting n = 8; Σu = – 8; Σv = – 29; Σuv = 172; Σu2 = 86 and Σv2 = 375 in the formula,
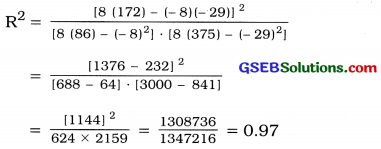
R2 = 0.97, hence the regression model is reliable.
Question 6.
Obtain the regression line of Y on X from the following data and estimate Y for X = 30 : n = 10, Σx = 250, Σy = 300, Σxy = 7900, Σx2 = 6500
Answer:
Here, n = 10; Σx = 250; Σy = 300; Σxy = 7900; Σx2 = 6500 are given,
Now, x̄ = \(\frac{\Sigma x}{n}\) = \(\frac{250}{10}\) = 25; ȳ = \(\frac{\Sigma y}{n}\) = \(\frac{300}{10}\) = 30
We obtain the regression line ŷ = a + bx of Y on X.
Now, b = \(\frac{n \Sigma x y-(\Sigma x)(\Sigma y)}{n \Sigma x^{2}-(\Sigma x)^{2}}\)
∴ b = \(\frac{10(7900)-(250)(300)}{10(6500)-(250)^{2}}\)
= \(\frac{79000-75000}{65000-62500}\)
= \(\frac{4000}{2500}\)
= 1.6
a = ȳ – bx̄
∴ a = 30 – 1.6 (25)
= 30 – 40
= – 10
Regression line of Y on X:
Putting a = – 10 and b = 1.6 in ŷ = a + bx, we get
ŷ = – 10 + 1.6x
Estimate of the value of Y when X = 30 :
Putting x = 30 in ŷ = – 10 + 1.6x, we get
ŷ = – 10 + 1.6(30)
= – 10 + 48 = 38
Hence, the estimate of Y obtained is ŷ = 38.
Question 7.
The following results are obtained for a data :
n = 12, Σx = 30, Σy = 5, Σx2 = 670, Σxy = 344 Later on, it was known that one pair (10, 14) was wrongly taken as (11, 4). By correcting the above measures, obtain the regression line of Y on X. Estimate Y for X = 5.
Answer:
Here, n = 12; Σx = 30; Σy = 5; Σx2 = 670; Σxy = 344 are given.
True pair of observation is (10, 14), i.e., x = 10, y = 14
False pair of observation is (11, 4), i.e., x = 11, y = 5
∴ Correct Σx = 30 + 10 – 11 = 29
Correct Σy = 5 + 14 – 4 = 15
Correct Σx2 = 670 + (10)2 – (11)2
= 670 + 100 – 121
= 649
Correct Σxy = 344 + (10 × 14) – (11 × 4)
= 344 + 140 – 44 = 440
Now, x̄ = \(\frac{\text { Correct } \Sigma x}{n}\) = \(\frac{29}{12}\) = 2.42
ȳ = \(\frac{\text { Correct } \Sigma y}{n}\) = \(\frac{15}{12}\) = 1.5
Regression line ŷ = a + bx of Y on X is to obtained.
Now, b = \(\frac{n \Sigma x y-(\Sigma x)(\Sigma y)}{n \Sigma x^{2}-(\Sigma x)^{2}}\)
Putting the corrected values in the formula,
b = \(\frac{12(440)-(29)(15)}{12(649)-(29)^{2}}\)
= \(\frac{5280-435}{7788-841}\)
= \(\frac{4845}{6947}\)
= 0.70
a = ȳ – bx̄
∴ a = 1.25 – 0.7 (2.42)
= 1.25 – 1.69 = – 0.44
Regression line of Y on X:
Putting a = – 0.44 and b – 0.7 in ŷ = a + bx, we get
ŷ = – 0.44 + 0.7x
Estimated value of Y when X = 5 :
Putting x = 5 in ŷ = – 0.44 + 0.7x, we get
ŷ = – 0.44 + 0.7(5)
= – 0.44 + 3.50 = 3.06
Hence, the estimated value of Y obtained is ŷ = 3.06.