Gujarat Board GSEB Class 11 English Textbook Solutions Reading Comprehension Data Interpretation Questions and Answers, Notes Pdf.
GSEB Class 11 English Reading Comprehension Data Interpretation
Data interpretation Is the process of assigning meaning to the collected information and determining the conclusions, significance and Implications of the findings. The goal of the Interpretation of data is to highlight information and suest conclusions.
![]()
Specimens of Data Interpretation
Question 1.
Look at the graph and the paragraph below which provides an interpretation of the data given in the graph:
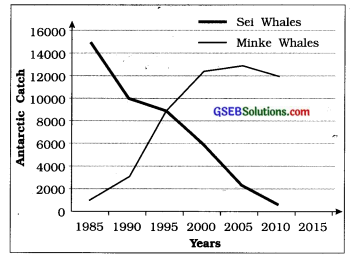
Graph to show number of whales caught in Antarctic (1985-2010)

Answer:
As whalers reduced catches of the larger whales, they switched to smaller species. This is evident when we compare figures for the Antarctic catch of the larger sei whale with those for small minke whale. In 1985, fifteen times as many sei whales as minke whales were caught. By 1995, catches of both the species were virtually the same (9000).
By the 2000, the situation had reversed and the number of minke whales killed more than doubled as compared to sei whales (6000). The graph shows that while the sei catch was reduced by 95% between 1985 and 2010, over the same period the minke whale catch was eight times greater. If these trends continue, the situation for the smaller species will be as bad as it used to be for the larger once.
![]()
Question 2.
Study the following columns showing temperature recorded at different places in Gujarat and write seven to eight sentences based on it:

Answer:
On April 6, 2019, the heatwave was very high all over Gujarat. The temperature recorded in some of the towns was really alarming. Idar was the hottest with 44 °C on April 6, Deesa stood the second with 42.7 °C. Ahmedabad and Vadodara recorded 42.4 °C each equally. Gandhinagar was scorching with 41.8 °C. Bhuj claimed 41 °C. which kept the people indoors. Rajkot recorded 40.7 °C, of course, less hot than Vadodara by 1.7 °C. Surat being close to the sea, had the lowest of all, i.e.,39.6°C.
Question 3.
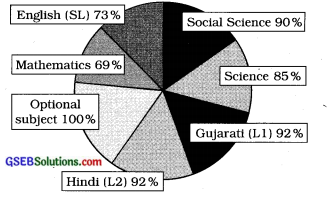
Study the following pie diagram showing the performance of the students of Std. 10 and write seven to eight sentences based on it:

Answer:
The result of standard 10 in the second term is satisfactory. Some subjects need to be taken care of. The optional subjects have the maximum percentage of passing in them as it is 100 %. Less than optional subjects but still a good percentage of 92 is seen in the first and second language, that is Gujarati and Hindi. About 90 % students passed in Social Science. Science also has 85 % students passing in it. In comparison to the first and second language, the third language – English (SL) has 73 % students passing in it. The lowest percentage is 69 and it is in Mathematics.
![]()
Question 4.
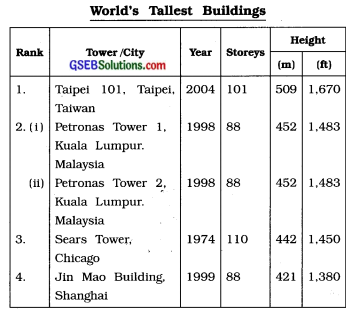
Study the following table showing World’s tallest buildings and write seven to eight sentences based on it:

Answer:
When we think about multi-storeyed buildings (skyscrapers), naturally we are curious to know about the tallest buildings in the world. The tallest building all over the world is Taipei 101. It is in Taipei town of Taiwan. It has 101 storeys and 509 metres height. The second tallest building in the world is Petronas Tower 1 in Kuala Lumpur, Malaysia, built-in 1998 with 88 storeys and having height of 1483 feet. Petronas Tower 2 is the twin building. The third tallest building in the world is the Sears Tower in Chicago with 110 storeys. It was built in 1974 and is 442 metres high. The fourth-tallest building is Jin Mao Building in Shanghai built-in 1999. It has 88 storeys and is 1380 feet high.