This GSEB Class 12 Commerce Statistics Notes Part 1 Chapter 2 Linear Correlation Posting covers all the important topics and concepts as mentioned in the chapter.
Linear Correlation Class 12 GSEB Notes
Meaning and Definition of Linear Correlation:
Meaning of Correlation:
If simultaneous changes occur in the values of two related variables due to direct or indirect cause- effect relation, then it can be said that there exists correlation between two variables.
Meaning of Linear Correlation:
If the points plotted on the graph paper corresponding to ordered pairs of the values of two correlated variables are on a line or nearer to the line, then correlation between to variables is said to be linear correlation.
Definition of Linear Correlation:
When the changes in the values of two correlated variables are nearly in constant proportion means the points of their ordered pairs are on a line or nearer to the line, then it is called linear correlation.
Types of Linear Correlation:
- Positive Correlation: When the changes in the values of two correlated variables are in the same direction, the correlation between the variables is said to be positive. The correlation between sale and profit of an item is the example of positive correlation.
- Negative Correlation: When the changes in the values of two correlated variables are in opposite direction, the correlation between the variables is said to be negative. The correlation between price and demand of an item is the example of negative correlation.
![]()
Correlation and Coefficient of Correlation:
- Correlation: If simultaneous changes occur in the values of two variables due to direct or indirect cause-effect relation, then it is said that there is correlation between two variables.
- Coefficient of Correlation: A numerical measure showing the strength or degree of a linear correlation between two variables is called the correlation coefficient. It is denoted by r.
Methods of Studying Correlation:
1. Scatter Diagram Method:
This is a simple method to find the nature or type (positive or negative) of correlation showing the values of variable X on X-axis and that of variable Y on Y-axis by an appropriate scale, the points corresponding to n ordered pairs (x1, y1), (x2, y2), …. (xn, yn) are plotted on the graph paper. The graph showing the plotted points is called a scatter diagram. The pattern of points on a scatter diagram shows the nature or type of correlation and the strength of correlation up to some extent.
2. Karl Pearson’s Product Moment Method:
The method of finding the measure of the strength of linear correlation between two variables X and Y using the n pairs (x1, y1), (x2, y2), …….. (xn, yn) of observations on two variables X and Y is called Karl Pearson’s product moment method.
3. Spearman’s Rank Correlation Method:
When n pairs of observations (x1, yx), (x2, y2), …, (xn, yn) on two variables X and Y are given, then the method by which the correlation coefficient computed using the ranks assigned to the values of two variables in descending order of magnitudes is called Spearman’s rank correlation method.
Properties of Correlation Coefficient:
- The maximum value of correlation coefficient r is 1 and the minimum value is – 1. Thus, – 1 ≤ r ≤ 1.
- Correlation coefficient r (x, y) between variables X and Y and the correlation coefficient r (y, x) between variables Y and X are equal. Thus, r (x, y) = r (y, x).
- The value of r is not changed by the change of origin and scale. This means r (x, y) = r (u, v); where u = \(\frac{x-\mathrm{A}}{\mathrm{C}_{x}}\) and v = \(\frac{y-B}{C_{y}}\); Cx >0, Cy > 0 and A, B, Cx, Cy are constants.
- The value of r is independent of units of measurements of variables X and Y.
- Coefficient correlation r is an absolute measure.
Interpretation of Value of Correlation Coefficient:
Interpretation of Value of r:
1. If r = 1, then it is said perfect positive linear correlation between two variables X and Y. Due to increase (or decrease) in the values of one variable, there is constant proportional increase (or decrease) in the values of another variable and the value of r = 1.
2. If r = – 1, it is said perfect negative linear correlation between two variables X and Y. Due to increase (or decrease) in the values of one variable results in constant proportional decrease (or increase) in the values of another variable and the value of r = – 1.
3. r = 0, it is said lack of linear correlation between two variables X and Y. So it is said there is no linear correlation between two variables X and Y.
4. 0 < r < 1, it is said partial positive linear correlation between two variables X and Y.
5. – 1 < r < 0, it is said partial negative linear correlation between two variables X and Y.
Spearman’s Coefficient Correlation:
Rank Correlation Coefficient: When the measurement of two variables are not in the form of numbers but they are in the form of their ranks, then the coefficient of correlation between X and Y is called rank correlation coefficient. Such measure of correlation coefficient was suggested by Spearman. Hence, it is known as Spearman’s rank correlation coefficient. It is also denoted by r.
Properties of Rank Correlation Coefficient:
- The minimum value of rank correlation coefficient is -1 and maximum value is 1. Thus, -1 ≤r ≤ 1.
- If ranks of variables X and Y are equal, i.e., Rx = Ry, then r = 1, which shows perfect positive linear correlation between X and Y.
- If ranks of variables X and Y are mutually reverse, then r = – 1 which shows perfect negative linear correlation between X and Y.
- When the values of two variables X and Y are some arrangement of first n natural numbers, the correlation coefficient obtained by Karl Pearson’s method and Spearman’s method are equal.
![]()
Precautions to be Considered while Interpreting
Coefficient of Correlation:
1. Coefficient of correlation is a measure of strength of linear correlation between two variables, but it gives no indication about presence of cause and effect relationship between them.
2. Sometimes there is no correlation between two variables even though due to presence of other factors, the value of | r | may be near to 1.
3. When r = 0, we can say that there is lack of linear correlation. But there may be non-linear relationship between them.
4. The bivariate data obtained for a given region or class or given time duration, then correlation coefficient computed for such data, its interpretation should be limited to such data only otherwise it leads to misunderstanding.
Important Formulae:
1. Product Moment Method (Karl Pearson’s Method):
r = \(\frac{\operatorname{Cov}(x, y)}{\mathrm{S}_{x} \cdot \mathrm{S}_{y}}\) ………(1)
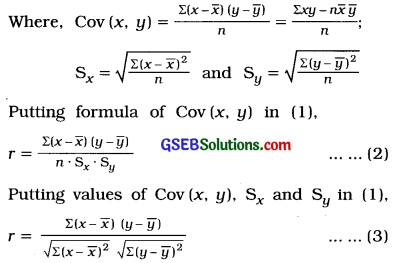
Formula (3) ¡s called product moment formula.
Putting formula of Coy (x, y) in (1).
r = \(=\frac{\Sigma x y-n \bar{x} \bar{y}}{n \cdot \mathrm{S}_{x} \cdot \mathrm{S}_{y}}\) …….(4)
Note: Formulae (1) to (4) are useful for short sums.
Based on original observations:
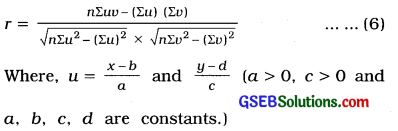
r = \(\frac{n \Sigma x y-(\Sigma x)(\Sigma y)}{\sqrt{n \Sigma x^{2}-(\Sigma x)^{2}} \times \sqrt{n \Sigma y^{2}-(\Sigma y)^{2}}}\) ….(5)
Shortcut Method:
2. Rank Correlation Method:
When observations are not repeated:
r = 1 – \(\frac{6 \Sigma d^{2}}{n\left(n^{2}-1\right)}\) ………(7)
Where, d = Rx – Ry
Rx = Rank of variable X
Ry = Rank of variable Y
When observations are repeated:
r = 1 – \(\frac{6\left(\Sigma d^{2}+C F\right)}{n\left(n^{2}-1\right)}\) ….(8)
Where d = Rx – Ry
Rx = Rank of variable X
Ry = Rank of variable Y
CF = Correction Factor = \(\Sigma\left(\frac{m^{3}-m}{12}\right)\)
m = No. of repeatations of a observation
Remember for the Calculation of Correlation Coefficient
1. The value of r is independent of the units of measurement of the variable. Suppose the weight and the height for a group of members are measured in kg and cm respectively or pounds and inches respectively, in either case the value of coefficient correlation r does not change.
2. The value of r is independent of the change of origin (adding or substracting any non-zero constant number) or the change of scale (multiplying or dividing by the value of any non-zero
constant number). Hence, if r(x, y) = 0.8, then r[(x – 2), (y + 3)] = 0.8 and r(2x, \(\frac{y}{2}\)) = 0.8.
But, r(-x, -y) = 0.8, r (-x, y) = -0.8 and r (x, -y) = -0.8.
3. When the information on ranks of the variables X and Y are given, calculate the rank correlation coefficient.
4. Use formula (3) for the calculation of the correlation coefficient by product-moment method.
5. Select the suitable formula from (1) to (6) to calculate Karl Pearson’s correlation coefficient.
6. Use formula (7) or (8) for the calculation of Spearmen’s rank correlation coefficient.