GSEB Gujarat Board Textbook Solutions Class 11 Economics Chapter 3 Demand Textbook Exercise Important Questions and Answers, Notes Pdf.
Gujarat Board Textbook Solutions Class 11 Economics Chapter 3 Demand
GSEB Class 11 Economics Demand Text Book Questions and Answers
1. Choose correct option for the following from the options provided :
Question 1.
Factors affecting demand can be classified into how many categories?
(A) One
(B) Two
(C) Three
(D) Four
Answer:
(B) Two
Question 2.
How is the demand curve sloped?
(A) Negative
(B) Positive
(C) Parallel to X-axis
(D) Parallel to Y-axis
Answer:
(A) Negative
Question 3.
What is the other name for poor quality commodities?
(A) Prestigious commodities
(B) Very cheap commodities
(C) Giffen commodities
(D) Useless commodities
Answer:
(C) Giffen commodities
Question 4.
How many types of price elasticity of demand are there?
(A) Two
(B) Four
(C) Five
(D) Seven
Answer:
(B) Four
Question 5.
What is the relationship between price and demand?
(A) Positive
(B) Inverse
(C) Equal
(D) Zero
Answer:
(B) Inverse
Question 6.
Which kind of commodities are called complementary commodities?
(A) Joint
(B) Competitive
(C) Not related
(D) Alternative
Answer:
(A) Joint
![]()
Question 7.
What is the movement of demand curve when demand expands?
(A) Upward
(B) Downward
(C) Right side on another demand curve
(D) Left side on another demand curve
Answer:
(B) Downward
Question 8.
Which one has no relation with demand curve?
(A) Specific time
(B) Specific price
(C) Consumer
(D) Supply
Answer:
(D) Supply
Question 9.
Who has presented law of demand?
(A) Adam Smith
(B) Alfred Marshall
(C) Robbins
(D) Keynes
Answer:
(B) Alfred Marshall
Question 10.
When products are expensive then how is the demand of prestigious goods of the rich?
(A) More
(B) Less
(C) Zero
(D) Negative
Answer:
(A) More
2. Answer the following questions in one sentence :
Question 1.
What is demand?
Answer:
The quantity of a commodity which a buyer desires, is able and willing to buy at a given price at a given point of time is called demand.
Question 2.
What is income elasticity of demand?
Answer:
The extent (degree) of change in demand for a good because of a change in income of the consumer is called income elasticity of demand.
Income elasticity (εy) = \(\frac{\text { Proportionate change in demand }}{\text { Proportionate change in income }}\)
Question 3.
What is cross elasticity of demand?
Answer:
When the demand of the concerned commodity changes in response to the change in price of its related good (either substitute or complementary good), then the extent of such change in demand is called cross elasticity or cross-price elasticity of demand. The cross-price elasticity may be a positive value or negative value, depending on whether the goods are complementary or substitutes.
Question 4.
When is there possibility of expansion – contraction of demand?
Answer:
Assuming other factors constant when the price falls or rises there is a possibility of expansion – contraction of demand.
Question 5.
In which situation does demand decrease or increase?
Answer:
Assuming price as constant when consumers increase (or decrease) their demand due to some other factors, it is known as increase (or decrease) in demand.
Question 6.
Why is the law of demand called as conditional law?
Answer:
The law of demand holds true only on the condition that the factors influencing demand other than the price remains constant. Hence it is…
3. Answer the following questions in short :
Question 1.
What is demand function?
Answer:
Demand function:
The cause and effect relationship between demand and its various factors can be expressed as a mathematical function.
- The demand function is a mathematical function between demand for a good and the determinants that affect its demand.
- The demand function shows that demand for a good is dependent on many factors such as price of the good, tastes and preferences of a consumer, income of the consumer, prices of related good, size of the population, etc.
The mathematical form of the demand function:
Dx = f (Px, Py, Pe, T, Y, U)
Where Dx = Demand for commodity X
f = Functional notation
Px = Price of commodity X
Py = Price of related commodity Y
Pe = Expectations regarding future price
T = Tastes and preferences of the consumer
Y = Consumer’s income
U = Other factors
Question 2.
What is substitution effect?
Answer:
Substitution effect:
- When price of the concerned good falls, it becomes relatively cheaper than its substitutes.
- Hence, a consumer wHI reduce the consumption of substitute goods and increase the demand for the concerned good. This is called substitution effect.
Example:
Consider two varieties of pants, namely, a pair of cotton pants and denim pants. If the price of cotton pants falls and that of denim pants remains the same .then the consumer finds the cotton pants cheaper compared to the denim pants. Hence, the demand for cotton pants will rise.
Question 3.
What is meant by Giffen goods?
Answer:
Giffen goods (Inferior goods):
- When price of certain goods namely inferior goods fall and the real income of a consumer rises he may reduce the consumption of such goods and substitute them with goods of superior quality.
- It was Robert Giffen who made these observations and explained this concept. Hence, these goods i.e. inferior goods are also called Giffen goods. Such goods are necessary goods and are purchased by the low-income groups.
Example:
- A person with low income purchases grains such as Jowar or Bajra for his daily diet. When the price of Jowar/Bajra falls drastically, the real income of the consumer tends to increase.
- Hence, he will reduce consumption of such goods and will purchase more of wheat which is the superior good.
- Another example is that of vegetable (vanaspati) ghee and pure ghee.
Question 4.
What is individual demand?
Answer:
Individual demand:
The demand of a good by an individual consumer at a given price at a particular point of time is called individual demand.
![]()
Question 5.
What is market demand?
Answer:
Market demand:
- The sum total of all individual demands of all existing consumers in the market at a given price at a particular point of time is called ‘market demand.
- The table given below shows individual demand of customers A, B and C.
- The last column of the data table is as summation of individual demands. This summated demand is called the market demand.
- The first three diagrams show individual demand of each customer whereas the fourth diagram shows their combined demand i.e. market demand.
Question 6.
What is price elasticity of demand?
Answer:
Price elasticity of demand:
The law of demand explains that when other factors of demand are assumed to be constant, as price falls demand expands and as price rises demand contracts. However, this law does not state by what proportion demand expands or contracts. The concept of price elasticity of demand explains this.
Meaning:
A measure that shows the proportion (extent) to which demand changes with . respect to change in price is called price elasticity of demand. It is denoted by εp.
Definition:
According to Marshall, the degree of elasticity of demand depends upon the extent of rise in demand because of a fall in price and upon the extent of fall in demand because of a rise in price.
Expression Example:
Let us assume that the price of a good ‘X’ falls by 1 %. This fall leads to a price rise of 5% in demand of good ‘X’.
Price Elasticity of Demand (εp) = \(\frac{\text { Percentage change in demand for } X}{\text { Percentage change in price of } \mathrm{X}}\)
= \(\frac{+5 \%}{-1 \%}\)
= |5|
Price elasticity of demand i.e. ep is expressed as a pure number and is unit-less i.e. it does not have any unit of measurement such as %, kg., meter, etc.
Question 7.
Which commodities are called prestigious commodities?
Answer:
Question 8.
State the names of methods to measure price elasticity of demand.
Answer:
The five types of price elasticity of demand are:
- Perfectly elastic demand (εp = ∞)
- Perfectly inelastic demand (εp = 0)
- Unitary (unit) elastic demand (εp = 1)
- Relatively elastic demand (εp >1)
- Relatively inelastic demand (εp < 1)
4. Answer the following questions in brief points :
Question 1.
Define income effect and substitution effect.
Answer:
1. Income effect:
When the monetary income of the consumer remains constant, but price of the good falls then his real income rises. Real income means the purchasing power of money income. When real income rises, a consumer can buy more quantity of a good and therefore its demand may rise. This is known as income effect on demand.
2. Substitution effect:
- When price of the concerned good falls, it becomes relatively cheaper than its substitutes.
- Hence, a consumer will reduce the consumption of substitute goods and increase the demand for the concerned good. This is called substitution effect.
Question 2.
Explain expansion and contraction of demand along with diagram.
Answer:
Expansion and contraction of demand:
- Expansion/contraction demand takes place when price varies and other determinants of demand are held constant.
- Keeping other determinants constant, if price falls demand expands and if prices rise, demand contracts.
Let us take an example to understand the expansion and contraction of demand:
The schedule (table) given below contains data of price of a commodity and
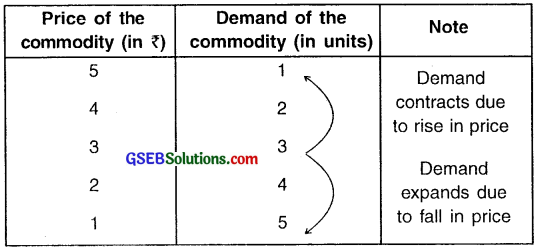
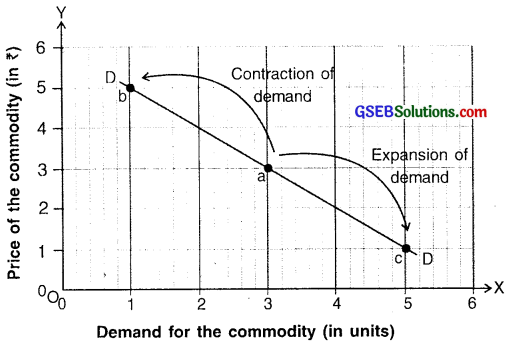
Expansion and contraction of demand
Suppose initially the price of the commodity is ₹ 3. At this price its demand is 3 units. This is plotted at point ‘a’ in the diagram.
Expansion:
When price falls to ₹ 1, demand expands to 5 units which is shown as point ‘ ‘c’ in the diagram. The downward movement from point ‘a’ to point ‘c’ on demand curve DD is called expansion of demand. (Note: The movement of the curve is downward because the price indicated on Y-axis has fallen.)
Contraction:
- In the second scenario, if the initial price of ₹ 3 rises to ₹ 5, the demand contracts from 3 units to 1 unit which is shown as point ‘b’ in the diagram. The upward movement from point ‘a’ to point ‘b’ on the same demand curve DD is called contraction of demand. (Note: The movement of the curve is upward because the price indicated on Y-axis has risen.)
- Expansion and contraction of demand occur on the same demand curve. Expansion is a downward movement on the demand curve and contraction is an upward movement on the demand curve.
Question 3.
Explain increase and decrease of demand and represent it diagramatically.
Answer:
- Increase/decrease in demand takes place when price is assumed constant and determinants other than price varies.
- Keeping price as constant, if factors/determinants other than price vary there occurs increase/decrease in demand.
- We take price which is an independent variable on Y-axis and demand on X-axis. So when price remains fixed i.e. constant, the demand (on horizontal axis) changes. This causes rightward/leftward shift in the demand curve DD.
Rightward shift:
Keeping price factor as constant, if demand increases due to any other factor, the demand curve will shift towards right which is called rightward shift in demand curve.
Leftward shift:
Keeping price factor as constant, if demand decreases due to any other factor, the demand curve will shift towards left which is called leftward shift in demand curve.
Let us take an example to understand the increase and decrease in demand:
The schedule (table) given below contains data of price of a commodity and its demand at various prices. Note that price ₹ 3 is constant. A demand curve is plotted for the given data.
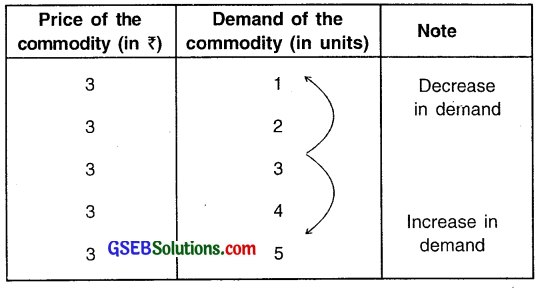
Increase and Decrease in Demand
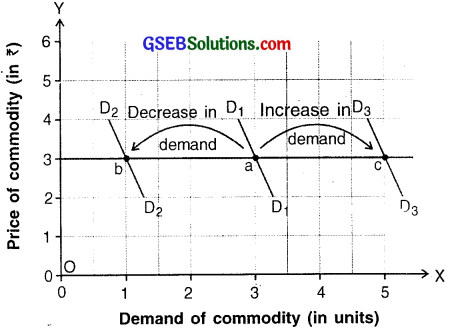
The initial demand is represented by demand curve D1 D1. Here, at price of ₹ 3 demand is 3 units. This is plotted at point ‘a’ on D1 D1.
Increase in demand:
When price remains constant at ₹ 3 but due to one or other factors demand increases to 5 units, then the demand curve shifts to the right to D3D3. This is indicated by rightward movement of demand curve from point ‘a’ to point ‘c’.
Decrease in demand:
- At constant price if the initial demand of 3 units decreases to 1 unit, the demand curve shifts leftward from point ‘a’ i.e. D1D1 to point ‘b’ i.e. D2D2.
- Thus, more than one demand curves are generated to depict increase or decrease in demand. A rightward shift of the demand curve shows increase . in demand and a leftward shift shows decrease in demand.
Question 4.
Explain income elasticity of demand.
Answer:
Meaning:
- Income elasticity of demand is useful to measure changes in the demand for a commodity with respect to changes in the income of a consumer.
- The extent (degree) of change in demand for a good because of a change in income of the consumer is called income elasticity of demand. It is denoted by εy.
- Income elasticity (εy) = \(\frac{\text { Proportionate change in demand }}{\text { Proportionate change in.price }}\)
Types/degrees of income elasticity of demand:
1. Positive income elastic demand:
There are three degrees of in positive income elasticity of demand. They are:
(A) Unit income elastic demand (εy = 1)
(B) Elasticity of demand greater than unity (εy > 1)
(C) Elasticity of demand less than unity (εy < 1)
2. Negative income elastic demand
3. Zero income elastic demand
![]()
Question 5.
Explain the exceptions to the law of demand.
Answer:
- As per the law of’ demand, when the price rises the demand falls and vice-versa. However, for some goods there are exceptions to this law.
- Under this exception, when price of a good falls, its demand also falls instead of rising and vice-versa. Thus, change in price creates demand to change in opposite direction than that indicated in the law of demand.
Examples of such goods are:
1. Prestigious goods:
- Certain goods which are priced very high and are generally consumed by very rich people like, expensive jewelry, expensive cars, expensive mobile phones, etc. are considered prestigious goods.
- Such goods are used by the rich as status symbols. Even if their price rises their demand expands instead of contracting.
- On the other hand, if their price falls, the rich may contract their demand and avoid buying such goods with a mindset that a fall in price means that the good is losing its prestige and will now be in reach of even common people.
- Examples of such products are Mercedes car, iPhone, etc.
2. Extremely low-priced goods:
- Certain goods are extremely low-priced. The consumer spends a very small proportion of his income on these products. For example, pins, stapler pins, toffee, etc.
- Even if price of such goods rise consumer’s demand for these goods may not fall. Similarly, if their price falls, the consumer may not expand his demand as he may not need more of such goods than his actual need.
3. Giffen goods (Inferior goods):
- When price of certain goods namely inferior goods fall and the real income of a consumer rises he may reduce the consumption of such goods and substitute them with goods of superior quality.
- It was Robert Giffen who made these observations and explained this concept. Hence, these goods i.e. inferior goods are also called Giffen goods. Such goods are necessary goods and are purchased by the low-income groups.
Example:
- A person with low income purchases grains such as Jowar or Bajra for his daily diet. When the price of Jowar/Bajra falls drastically, the real income of the consumer tends to increase.
- Hence, he will reduce consumption of such goods and will purchase more of wheat which is the superior good.
- Another example is that of vegetable (vanaspati) ghee and pure ghee.
4. Special preferences of people:
At times, people get very accustomed and used to certain goods. They cannot do with any other good. Even if there is some rise in the price of their preferred goods, their demand may not decrease.
Example:
A specific brand of Ketchup, tooth paste, shoes, etc.
5. Answer the following questions in detail :
Question 1.
Explain individual demand and market demand along with diagrams.
Answer:
In economics we can classify demand in two parts. They are:
1. Individual demand:
The demand of a good by an individual consumer at a given price at a particular point of time is called individual demand.
2. Market demand:
- The sum total of all individual demands of all existing consumers in the market at a given price at a particular point of time is called ‘market demand.’
- The table given below shows individual demand of customers A, B and C.
- The last column of the data table is as summation of individual demands. This summated demand is called the market demand.
The first three diagrams show individual demand of each customer whereas the fourth diagram shows their combined demand i.e. market demand.
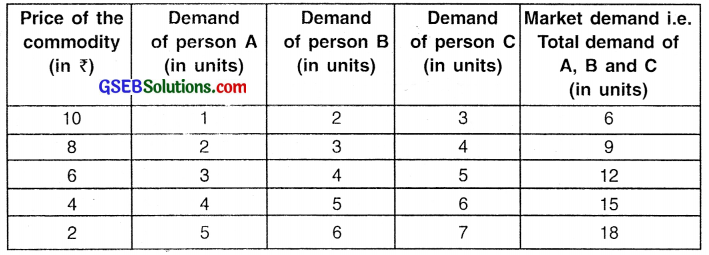
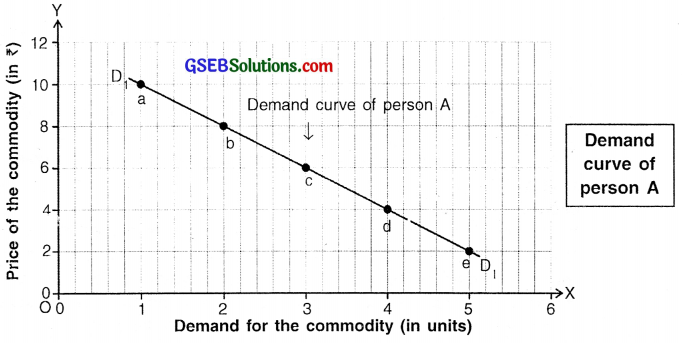
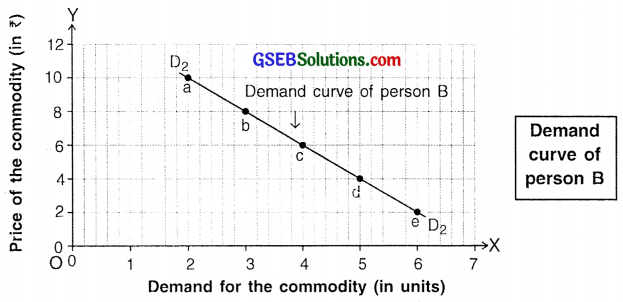
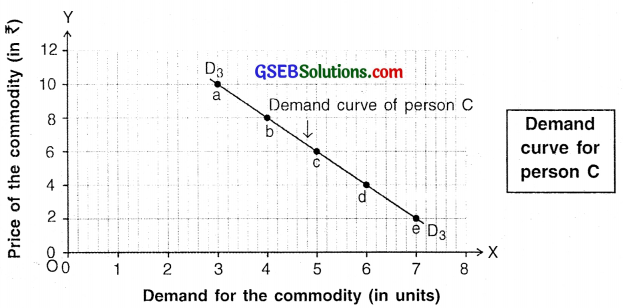
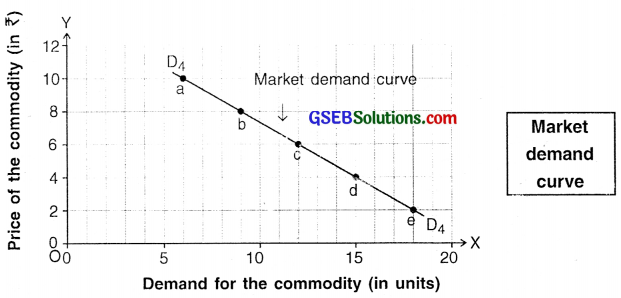
Individual demand curves and market demand curve
Conclusion:
Since demand curve of individual demands of all customers i.e. A, B and C have downward sloping curves, the market demand curve also slopes downwards.
Question 2.
Define demand and explain factors affecting demand.
Answer:
Demand:
The quantity of a commodity which a buyer desires, is able and willing to buy at a given price at a given point of time is called demand.
Demand is defined or determined by five factors namely:
- Desire,
- Willingness to buy,
- Ability to buy,
- A particular price and
- A particular point of time.
All these five factors are necessary for defining demand.
The factors that determine demand i.e. determinants of demand of a commodity/service can be classified into two main parts. They are:
(I) Price of commodity/service
(II) Factors other than price (i.e. other determinants)
(I) Price of a commodity/service:
- Price of a good is the most important determinant of its demand.
- When price of a good falls, a thoughtful consumer buys more and the demand expands. When price falls thoughtful consumers buys less and so demand contracts.
(II) Other determinants:
1. Tastes and preferences of a consumer:
- Demand depends a lot on tastes and preferences of a consumer.
- Tastes and preferences are associated with the likes and dislikes of a consumer as well as several other factors such as age, trends, etc.
Example:
- If a person is fond of reading, his preference for reading will change with age.
- At a young age, a person prefers to read story books, at adolescence he may prefer*to read novels and in old age*may prefer to read spiritual books.
2. Income of a consumer:
- The demand for a commodity increases with increase in the consumer’s income. Similarly, when his income falls, his demand for a good falls. Thus, there is a direct relationship between income and demand.
Inferior goods: - Contrary to this fact, there are some goods called inferior goods on which this direct relationship does not hold true.
- In economics, an inferior good is a good whose demand decreases when consumer’s income rises or whose demand rises when consumer’s income decreases.
Example of inferior goods/services:
For example, travelling through inter-city bus is a cheaper (inferior) mode than air or rail travel, but is more time-consuming. When a consumer has less money he prefers traveling by bus i.e. demand for bus travel is more. However, when his income rises he prefers faster and more comfortable transport system such as private car or by air i.e. demand for bus travel decreases.
3. Prices of related goods:
Goods such as french-fries and ketchup that are closely related to each other are called related goods. The price of refated goods is one of the other factors affecting demand.
Related goods are classified as either
- Substitute goods or
- Complementary goods.
The demand for a particular good depends upon the price and availability of its related goods, namely, substitute goods and complementary goods. For example, If the price of french-fries gets doubled the demand for ketchup may decline.
4. Expectations about future prices:
An individual’s expectation about the future price of a good affects his current demand for that good. If the consumer expects the price of a good to rise in the future, his demand for that good increases in the current time and vice-versa.
5. Size and demographic profile of population:
- The size of population, as well as the demographic profile of the people, impacts the total market demand for a good.
- If the population of a region is large then total market demand will be more and vice-versa. Similarly, if majority of population belongs to a particular age-group then the demand for certain goods in the market will be more.
- For example, a Cafe will be in more demand near colleges because of high concentration of youths.
Question 3.
Explain law of demand with the help of schedule and diagram.
Answer:
Demand schedule:
- A demand schedule is a table that shows the willingness of a consumer to buy different quantities of a good at various prices.
- The graphical representation of a demand schedule is called a demand curve.
Example:
The data shown in the table below is an imaginary example of a demand schedule.
| Price of milk (in ₹) | Demand of milk (in litres) |
| 50 | 1 |
| 40 | 2 |
| 30 | 3 |
| 20 | 4 |
| 10 | 5 |
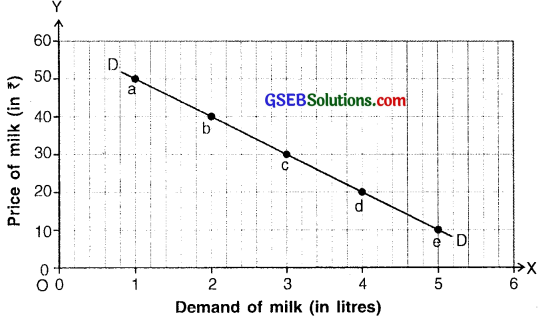
Diagram for law of demand
The schedule (table) shows various prices of milk and its demand at those prices.
- The data of schedule is plotted on a graph to obtain a demand curve.
- Price of milk which is an independent variable is taken Y-axis and demand for milk which is dependant on price is taken on X-axis.
Demand curve:
- By plotting the demand given in the schedule at various prices, we get points ‘a’, ‘b’ ‘c’, ‘d’ and ‘e’. These plotted points show the various price- demand combinations.
- On joining these points, we get the demand curve ‘DD’. This curve slopes downward from left to right which indicates that there is an inverse relationship between price and demand.
Explanation of the demand curve:
At point ‘a’, price of milk is ₹ 50 and demand is 1 litre. At point ‘b’, when the price falls to ₹ 40 the demand rises to 2 liters. Similarly, at point ‘e’ when price falls to as low as? 10, the demand expands to as high as 5 liters.
Analysis/Conclusion:
- Price and demand and inversely proportionate i.e. when price rises, demand falls and vice-versa.
- This inverse relationship occurs because of two reasons. They are:
- Income effect and
- Substitution effect.
![]()
Question 4.
Define price elasticity of demand and explain its types with diagrams.
Answer:
Price elasticity of demand:
- A measure that shows the proportion (extent) to which demand changes with respect to change in price is called price elasticity of demand. It is denote by ep.
- According to Marshall, the degree of elasticity of demand depends upon the extent of rise in demand because of a fall in price and upon the extent of fall in demand because of a rise in price.
- Price elasticity of demand = \(\frac{\text { Proportionate change in demand }}{\text { Proportionate change in.price }}\)
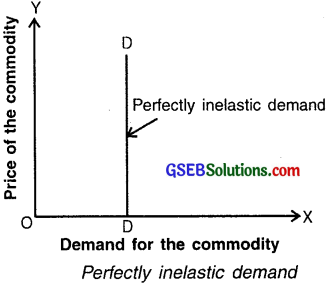
Perfectly inelastic demand (εp = 0):
- Perfectly inelastic demand is opposite of perfectly elastic demand.
- When price of a commodity say commodity ‘K’ changes by any amount, say 10% but there is absolutely no change in its demand then such a demand is called perfectly inelastic demand.
- εp = \(\frac{\text { Proportionate change in demand }}{\text { Proportionate change in price }}\)
= \(\frac{0 \%}{+10 \%}\) = 0 (zero) - In perfectly elastic demand, price elasticity i.e. εp = 0
- As shown in the diagram, the ‘DD1’ demand curve is a vertical straight line parallel to Y-axis. The curve shows that whatever be the change in price, the demand remains constant. Such elasticity of demand is always zero.
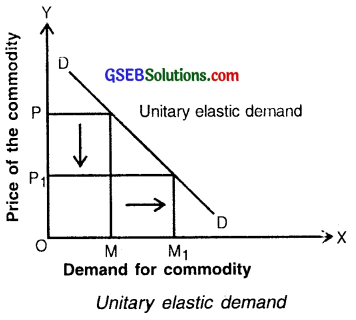
Unitary elastic demand (εp = 1)
- When the percentage (proportionate) change in demand is equally proportionate to percentage (proportionate) change in price then it is called unitary elastic demand.
- For example, if price of commodity ‘S’ falls by 5% and its demand also by changes by 5%, then it is called unitary change in demand.
- εp = \(\frac{\text { Proportionate change in demand }}{\text { Proportionate change in price }}\)
= \(\frac{+5 \%}{-5 \%}\) = |1| - In unitary elastic demand, price elasticity i.e. = 1.
As shown in the diagram, on the demand curve ‘DD’, when price falls by PP1, demand expands by MM1. Note that PP1 = MM1.
Relatively elastic demand (εp > 1):
1. When price elasticity i.e. εp> 1, it is called relatively, elastic demand. When a percentage change in demand is proportionately more than percentage change in price then such demand is called relatively elastic demand.
2. This type of elasticity is observed for luxury goods like televisions, cars etc. For example, if price of commodity ‘R’ rises by 10 % and its demand falls by 30 %, than its demand is called relatively elastic demand.
εp = \(\frac{\text { Proportionate change in demand }}{\text { Proportionate change in price }}\)
= \(\frac{-30 \%}{+10 \%}\) = |3|
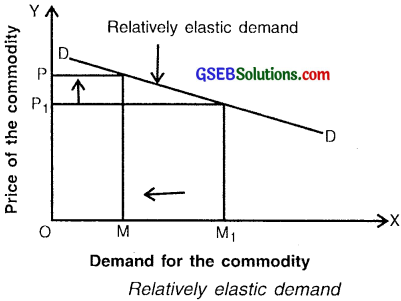
3. As can be seen from the calculation, a small rise (change) of 10% in the price made a large change of 30% in the demand of the commodity.
4. In the diagram, on the Demand for the commodity demand curve DD1, when price rises by PP1 amount, demand falls by MM1 amount which is proportionately greater than that of price.
Relatively inelastic demand (εp < 1):
- When percentage change in demand is proportionately lesser than percentage change in price then such demand is called relatively inelastic demand.
- For example, when price of commodity ‘G’ rises by 20 % and as a result its demand falls only by 5 % then its demand is called relatively inelastic demand.
- When price elasticity is less than 1, 0 then the demand is called inelastic demand and ε0 < 1.
- This type of elasticity is found for g goods of daily needs such as food grains, milk, oil, etc.
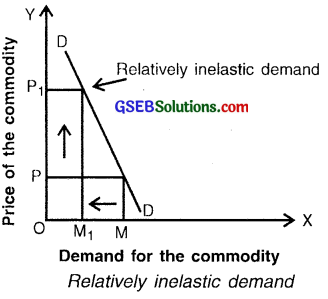
εp = \(\frac{\text { Pr oportionate change in demand }}{\text { Proportionate change in price }}\)
= \(=\frac{-5 \%}{+20 \%}=-\frac{1}{4}\) |0.25|
In the diagram, on demand curve ‘DD1’, when price rises by PP1 amount, demand falls by MM1 amount which is proportionately lesser than that of price.