GSEB Gujarat Board Textbook Solutions Class 11 Economics Chapter 4 Supply Textbook Exercise Important Questions and Answers, Notes Pdf.
Gujarat Board Textbook Solutions Class 11 Economics Chapter 4 Supply
GSEB Class 11 Economics Supply Text Book Questions and Answers
1. Choose correct option for the following from the options provided :
Question 1.
What are the changes that take place in supply due to decrease in the price of a commodity?
(A) Increase
(B) Expansion
(C) Contraction
(D) Decrease
Answer:
(D) Decrease
Question 2.
What are the changes that take place in supply due to change in factors other than price?
(A) Increase
(B) Expansion
(C) Expansion-contraction
(D) Increase-decrease
Answer:
(C) Expansion-contraction
Question 3.
What is the relationship between price and supply of commodity?
(A) Direct
(B) Opposite
(C) Equal
(D) Zero
Answer:
(A) Direct
Question 4.
What decreases, therefore profit decreases and due to that supply decreases?
(A) Stock
(B) Supply
(C) Price
(D) Price elasticity of demand
Answer:
(C) Price
Question 5.
Stock is always ________ than supply.
(A) Higher
(B) Lower
(C) Not higher
(D) Negligible
Answer:
(A) Higher
![]()
Question 6.
If there is expectation about rise in price in future then present supply ________
(A) Increases
(B) Decreases
(C) Remain constant
(D) Become zero
Answer:
(B) Decreases
2. Answer the following questions in one sentence :
Question 1.
What is stock?
Answer:
The total available quantity of goods with a producer which can be offered for sale in the market as per the ability and willingness of the seller is called stock.
Question 2.
Which are the two matters on, which law of supply is presented?
Answer:
On price and factors other than price.
Question 3.
Define supply.
Answer:
The quantity of production which a producer is able and willing to sell in the market at a given price and at a particular point of time is called supply.
Question 4.
What is supply schedule?
Answer:
A schedule is a data table that shows a seller’s willingness to sell a good at various prices and is called the supply schedule.
Question 5.
How is the slope of supply curve?
Answer:
Positive slope.
Question 6.
Why is the law of supply not applicable to rare articles?
Answer:
Rare articles do not have any current production. Hence…..
Question 7.
Which types of commodities are an exception to the law of supply?
Answer:
Rare goods and perishable goods.
3. Answer the following questions in short :
Question 1.
Distinguish : Stock and Supply.
Answer:
| Point | Stock | Supply |
| Meaning | Stock refers to entire quantity of a commodity which is in the custody of the seller. So it is the potential supply. | Supply refers to the quantity of a commodity offered for sale at a given price and at a given time and place. |
| Dependence | Stock depends on production. | Supply depends on stock and price and Willingness |
| Relationship | Stock can be greater than the supply. | Supply cannot be greater than the stock. Supply can be either equal or less than the stock. |
| Order of existence | Stock comes before supply | Supply follow stock. There cannot be supply without stock. |
![]()
Question 2.
Explain meaning of individual supply and market supply.
Answer:
In economics we can classify supply in two parts. They are:
1. Individual supply:
The supply of a good by an individual firm/seller at a given price at a particular point of time is called individual supply.
2. Market supply:
- The sum total of all individual supplies of all existing sellers in the market at a given price at a particular point of time is called market supply.
- The schedule (table) given here shows the individual supply of apples by two different firms (A) and (B).
- The last column of the data table is as summation of individual supplies. This summated supply is called the market supply.
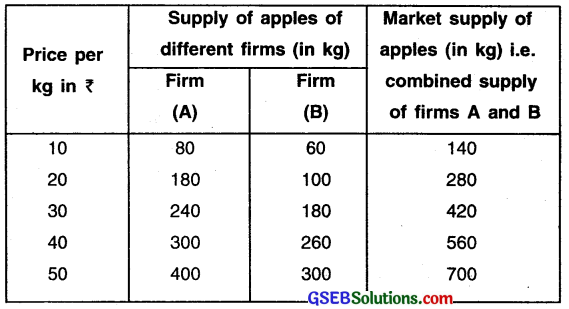
- As can be seen in the schedule, when price is higher, supply is more and when price is lower, supply is lesser. This relation between price and supply can be explained by a law, which is known as ‘Law of Supply’.
- Based on the values given in the schedule, we can prepare individual and market supply curves. Since there is a positive relationship between price and supply, these curves have a positive slope.
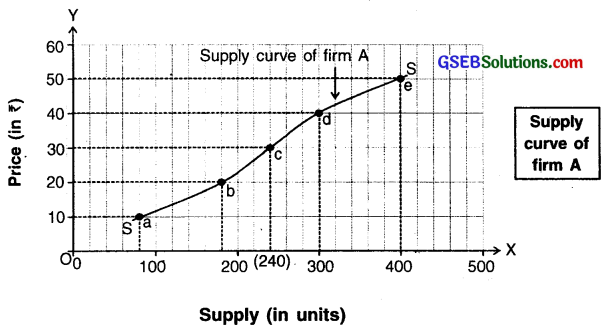
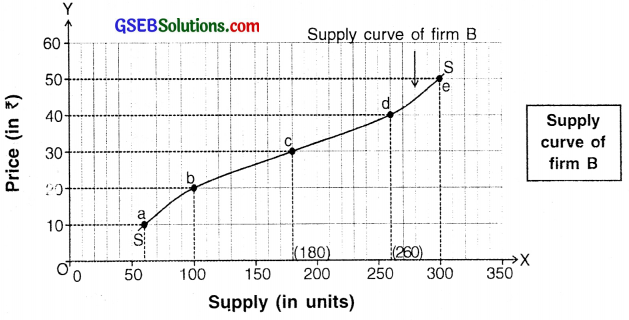
Diagrams for individual and market supply curves
Question 3.
Why can supply be more than production, but can not be more than stock?
Answer:
- Supply of a commodity can be equal to or less than the total stock plus production but not more than that.
- For example, during a year a firm produces 100 units. The past stock is 30 units. So, the total sellable stock becomes 130 units. This means that the seller can supply maximum 130 units but not more than that.
- Hence, the supply can be more than production but not more than the stock.
Question 4.
The supply curve is positively sloped. Explain with reasons.
Answer:
- As per the law of supply, as price increases, supply expands and as price decreases, supply contracts. This means there is a direct relationship between price and supply.
- When we plot the points of any direct relationship between two variables, we get an upward positively sloped curve.
- Hence, the supply curve is also positively sloped.
4. Answer the following questions in brief points :
Question 1.
Write short note on supply function.
Answer:
Supply function:
- The supply function specifies a functional (mathematical) relationship between supply of a good and its determinants i.e. factors affecting the supply.
- The supply function represents that the supply of one good is determined by many factors.
Mathematical form of the supply function:
Sx = f(Px, T, Pf, P0, U)
where Sx = Supply of commodity X
f = Functional notation
Px = Price of commodity X
T = Level of technology
PF = Factor prices
Pe = Expectations regarding future prices
U = Other factors
Question 2.
State exceptions to the law of supply.
Answer:
Law of supply:
“When all other factors affecting supply are assumed to be constant, as price increases, supply expands and as price decreases, supply contracts”. The definition tells that there is a direct and positive relationship between price and supply. This relationship is called law of supply.
Assumptions of law of supply:
- Over and above time, several factors affect the supply of a good at a particular point of time. However, at given point of time, the law of supply assumes the effect of all factors on supply other than the price as constant.
- In reality, other than price there are some other factors that can influence the supply more. However, we assume these to be constant.
Some important assumptions of law of supply:
- Prices of factors of production remain constant.
- There is no change in technology.
- Level of competition remains the same. In other words, number of sellers in the market remains the same.
- Expectations regarding future prices are ignored/held constant.
- Other factors like government policy, transport facilities, natural factors, etc. remain constant.
![]()
Question 3.
Explain expansion-contraction of supply along with diagram.
Answer:
Expansion-contraction of supply:
- Wiien factors other than price are assumed to remain constant and price varies, there occurs expansion and contraction of supply.
- These other factors may be, change in cost of factors of production, number of sellers, level of technology, government policies, etc.
Example:
- Let us take an example to understand the expansion and contraction of supply.
- The schedule given here shows various price of apples and its supply at, that prices.
| Price of apples per kg (in ₹) | Supply of apples (in kg) |
| 50 | 200 |
| 60 | 400 |
| 70 | 600 |
| 80 | 800 |
| 90 | 1000 |
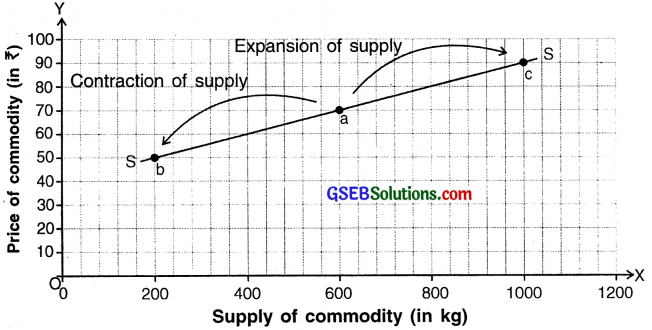
Expansion and contraction of supply
Analysis:
In the diagram, price of apples is represented on ‘Y-axis and their supply on ‘X-axis. Suppose the initial price of apple is ₹ 70 per kg. At this price, the initial supply is 200 kg. which is plotted as point ‘a’ on the supply curve.
Expansion:
- As can be seen in schedule, when price rises to ₹ 80, supply expands to 800 kg. When price further rises to ₹ 90, supply expands to 1,000 kg. which is plotted as point ‘c’.
- The movement from point ‘a’ to point ‘c’ on supply curve SS is called expansion of supply.
Contraction:
- Now from the initial point ‘a’ if price falls to ₹ 60, supply contracts to 400 kg. Similarly, if price falls further to ₹ 50 the supply contracts to 200 kg. which is plotted as point ‘b’ on the supply curve.
- The movement from point ‘a’ to point ‘c’ on the same supply curve SS is called contraction of supply.
Question 4.
Explain increase-decrease of supply along with diagram.
Answer:
Increase-decrease in supply:
Assuming price as constant if the supply increase/decrease due -to some other factors, it is known as increase/ decrease in supply.
Rightward shift:
- Keeping price facto, constant, if supply increases due to any other factor, the supply curve will shift towards right which is called rightward shift in supply curve.
- The factors responsible for rightward shift could be fall in cost of production, fall in prices of factors of production, improvement in technology, rise in number of suppliers, government policies, etc.
Leftward shift:
- Keeping price factor as constant, if supply decreases due to any other factor, the supply curve will shift towards left which is called leftward shift in supply curve.
- Leftward shift takes place when one or more above mentioned factors behaves in a reversed manner.
Let us take an example to understand the increase and decrease in supply:
- The schedule (table) given below contains data of price of a commodity and its various supply at that constant price.
- Note that price ₹ 20 is constant. A supply curve is plotted for the given data.
| Price of apples (in ₹) | Supply of apples (in kg) |
| 20 | 100 |
| 20 | 200 |
| 20 | 300 |
| 20 | 400 |
| 20 | 500 |
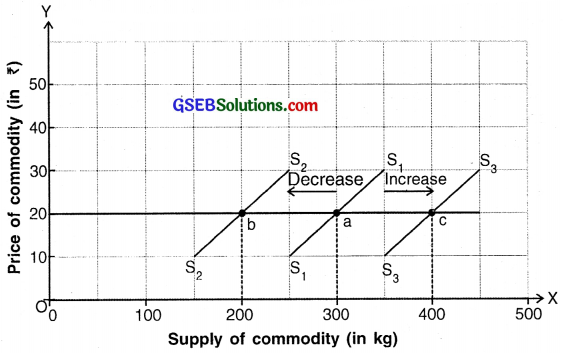
Increase and decrease of supply
- In the diagram, price is represented on the ‘Y-axis and supply on the ‘X-axis.
- Initial supply curve is represented by S1S1. Here, at price of ₹ 20 the supply of apples is 300 kg. This is plotted as point ‘a’ on the supply curve S1S1.
Increase in supply:
- When price remains constant at ₹ 20 but one or some of the other factors change in favour of supply of apples then the supply curve shifts to the right to S3S3 and the supply of apples increases to 400 kg. This is indicated by rightward movement of supply curve from point ‘a’ to point ‘c’ on S3S3.
Decrease in supply: - At constant price, if one or some of the other factors change against the supply of apples then the supply curve shifts to the left to S2S2 and the supply of apples decreases to 200 kg. This is indicated by leftward movement of supply curve from point ‘a’ to point ‘b’ on S2S2.
5. Answer the following questions in detail :
Question 1.
Discuss in detail the factors affecting supply.
Answer:
Factors that affect supply can be classified under two groups. They are:
- Price of the good (product) and
- Factors other than price.
1. Price of the good (product):
- Price is an important determinant of supply.
- A producer sells goods for earning profit. In order to earn higher profit, he supplies more goods when the price of a product rises and less when the price falls.
- Thus, there is a positive relationship between price of a good and its supply.
2. Factors other than price:
(A) Price of factors of production cost of production:
Change in cost of production affects its supply.
Example:
- When rent paid to the owner of land or wages paid to the labourer, decrease, the cost of production decreases.
- When cost of production decreases and if price remains unchanged, the profits increase. Hence, the seller is more willing to sell large quantity. Thus, supply expands when prices of factors of production fall.
- On the contrary, if cost of production rises, the situation becomes opposite and the supply contracts.
(B) Level of technology:
- When technology advances, time and efforts are saved. Hence, goods in large quantities and better quality can be produced that too with the same or lower costs.
- To add to this, if market price does not fall then profits increase and sellers are willing to sell more. Thus, supply expands.
(C) Future expectations about price:
If sellers speculate price of a product to rise in future then they contract the current demand so that they can build up stock for the future and vice, versa. Thus, future expectations about price affect the current supply of goods.
(D) Other factors:
Other factors that increase supply are:
- Increase in number of firms producing the product
- Existence of political stability in the state
- Favorable natural conditions
- Presence ,qf efficient law and order and legal systems
- Industrial relations are maintained well between owners and workers of production and marketigg activities, etc.
- On the other hand, supply decreases when the above factors become negative.
![]()
Question 2.
Explain law of supply in detail with the help of a schedule and diagram.
Answer:
(A) Law of supply:
“When all other factors affecting supply are assumed to be constant, as price increases, supply expands and as price decreases, supply contracts”. The definition tells that there is a direct and positive relationship between price and supply. This relationship is called law of supply.
Assumptions of law of supply:
- Over and above time, several factors affect the supply of a good at a particular point of time. Flowever, at given point of time, the law of supply assumes the effect of all factors on supply other than the price as constant.
- In reality, other than price there are some other factors that can influence the supply more. However, we assume these to be constant.
Some important assumptions of law of supply:
- Prices of factors of production remain constant.
- There is no change in technology.
- Level of competition remains the same. In other words, number of sellers in the market remains the same.
- Expectations regarding future prices are ignored/held constant.
- Other factors like government policy, transport facilities, natural factors, etc. remain constant.
(B) Supply schedule:
A schedule is a data table that shows a seller’s willingness to sell a good at various prices called the supply schedule.
Example:
The table shown here represents the willingness of a seller to sell apples at different prices.
| Price of apples per kg (in ₹) | Supply of apples (in kg) |
| 50 | 200 |
| 60 | 400 |
| 70 | 600 |
| 80 | 800 |
| 90 | 1000 |
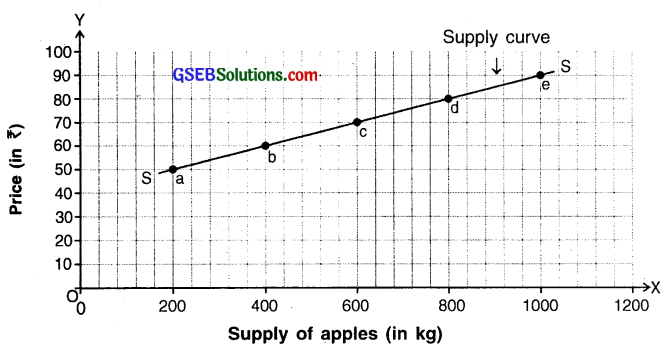
Diagram of law of supply
Analysis:
- In the diagram, price of apples is represented on ‘Y-axis and supply of apples on ‘X-axis.
- On plotting these points on the graph we get points a, b, c, d and e. x These points on the graph show the various price-supply combinations.
- As can be seen in the graph, when price is ₹ 50, supply is 200 kg, when price rises to ₹ 60, supply extends to 400 kg and when price rises still further to ₹ 70, supply extends to 600 kg and so on.
- The curve SS formed by joining these points is called the supply curve. It has a positive slope.
Question 3.
Explain the price determination process of market along with a diagram.
Answer:
Process of price determination:
- A consumer thinks that prices are decided by the producer or seller. But in reality individual producers or sellers do not decide the prices.
- Prices are determined by the interaction of market demand and supply.
- As per demand schedule, as the price rises the demand decreases where as in supply schedule, as price rises the supply increases. Thus, the demand curve slopes downward from left to right where as the supply curve slopes upward from left to right.
- Since supply schedule and demand schedule move in opposite directions, equilibrium is attained only at a point where these two curves intersect each other. This point of intersection is called point of price equilibrium. Such an equilibrium price for goods exists in the market.
- Individual sellers take this equilibrium price as a signal to determine prices of their individual products in the market.
- In case of perfect competition firms take this price as signal whereas in case of monopoly and oligopoly, markets take this price as a signal. Even a monopolist has to take a price signal from the total demand and total supply.
Example:
- The schedule given below shows demand and supply of a commodity at various prices. The diagram shows the demand and supply curve and their interaction.
- According to Marshall, the market demand and market supply are called the invisible hands of market and the entire process is invisible. The two curves i.e. the demand curve and supply form a cross as shown in the figure.
- In the figure, the demand curve DD and the supply curve SS move in the opposite directions. They intersect at point ‘E’ which is called the equilibrium point.
- At equilibrium point the equilibrium price is ₹ 30 which can be determined by plotting EQ. At this price, quantity demanded and supplied i.e. OQ is 600 units. This is called the equilibrium quantity.
| Price of a commodity (in ₹) | Demand of commodity (in kg) | Supply of commodity (in kg) |
| 10 | 1000 | 200 |
| 20 | 800 | 400 |
| 30 | 600 | 600 |
| 40 | 400 | 800 |
| 50 | 200 | 1000 |
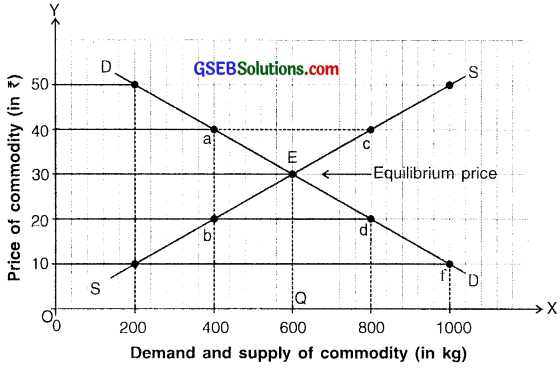
Diagram of price determination
Case 1:
If the industry raises its price to ₹ 40 then ignoring the demand and supply schedules, the total demand contracts to 400 units from 600 units while the supply expands to 800 units. Since demand is lesser than supply as shown by the distance between points ‘a’ and ‘c’, the market price will tend to fall back to ₹ 30. This is called the equilibrating process of the market.
Case 2:
Suppose if price is reduced by the industry to ₹ 20 by ignoring the demand and supply schedules, the total demand expands to 800 units while supply contracts to 400 units. Since demand is greater than supply as shown by the distance between points ‘d’ and ‘b’, the market price will tend to rise back to ₹ 30. This again is the invisible process of the market.