Gujarat Board Statistics Class 12 GSEB Solutions Part 1 Chapter 2 Linear Correlation Ex 2 Textbook Exercise Questions and Answers.
Gujarat Board Textbook Solutions Class 12 Statistics Part 1 Chapter 2 Linear Correlation Ex 2
Section A
Answer the following questions by selecting a correct option from the given options:
Question 1.
In context with correlation, what do you call the graph, if the points of paired observations (x, y) are shown in a graph?
(a) Histogram
(b) Circle diagram
(c) Scatter diagram
(d) Frequency curve
Answer:
(c) Scatter diagram

Question 2.
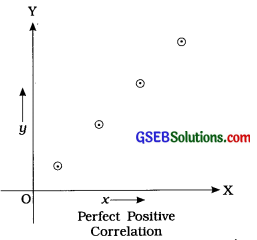
Which kind of the correlation exists if the following scatter diagram is of two variables X and Y?

(a) Perfect Positive Correlation
(b) Partial Positive Correlation
(c) Perfect Negative Correlation
(d) Partial Negative Correlation
Answer:
(a) Perfect Positive Correlation
Question 3.
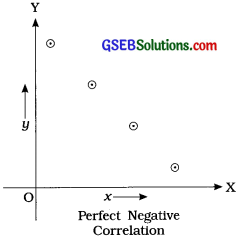
Which kind of the correlation exists if the following scatter diagram is of two variables X and Y?

(a) Perfect Positive Correlation
(b) Partial Positive Correlation
(c) Perfect Negative Correlation
(d) Partial Negative Correlation
Answer:
(d) Partial Negative Correlation
Question 4.
What is the value of r, if all the points plotted in a scatter diagram lie on a single line only ?
(a) 0
(b) 1 or – 1
(c) 0.5
(d) – 0.5
Answer:
(b) 1 or – 1
Question 5.
What is the range of the correlation coefficient r?
(a) – 1 < r < 1
(b) 0 to 1
(c) – 1 ≤ r ≤ 1
(d) – 1 to 0
Answer:
(c) – 1 ≤ r ≤ 1
Question 6.
The measurement unit of a variable ‘Weight’ is kg and that of ‘Height’ is cm. What can you say about the measurement unit of the correlation coefficient between them ?
(a) kg
(b) cm
(c) km
(d) does not have any unit
Answer:
(d) does not have any unit
Question 7.
Which kind of the correlation can be obtained if the two variables are varying in opposite direction in constant proportion ?
(a) Partial Positive Correlation
(b) Perfect Negative Correlation
(c) Perfect Positive Correlation
(d) Partial Negative Correlation
Answer:
(b) Perfect Negative Correlation
Question 8.
What does the numerator indicate in the formula for calculating the correlation coefficient by Karl Pearson’s method ?
(a) Product of variance of X and Y
(b) Covariance of X and Y
(c) Variance of X
(d) Variance of Y
Answer:
(b) Covariance of X and Y
Question 9.
Which of the following values is not possible as a value of r ?
(a) 0.99
(b) – 1.07
(c) -0.85
(d) 0
Answer:
(b) – 1.07
Question 10.
If u = \(\frac{x-\mathrm{A}}{\mathrm{C}_{x}}\) and v = \(\frac{y-B}{C_{y}}\), Cx > 0, Cy > 0, then which of the following statement is correct?
(a) r (x, y) ≠ r (u, v)
(b) r (x, y) > r (u, v)
(c) r(x, y) = r (u, v)
(d) r (x, y) < r(u, v)
Answer:
(c) r(x, y) = r (u, v)
Question 11.
If r(x, y) = 0.7, then what is the value of r (x + 0.2, y+ 0.2)?
(a) 0.7
(b) 0.9
(c) 1.1
(d) – 0.7
Answer:
(a) 0.7
Question 12.
If r(-x, y) = – 0.5, then what is the value of r(x, -y)?
(a) 0.5
(b) – 0.5
(c) 1
(d) 0
Answer:
(b) – 0.5
Question 13.
What is the value of the rank correlation coefficient if Σd2 = 0?
(a) 0
(b) – 1
(c) 1
(d) 0.5
Answer:
(c) 1
Question 14.
In the method of rank correlation, in usual notations if Rx = Ry for each pair of observations, then what is the value of the r?
(a) 0
(b) – 1
(c) 1
(d) 0.1
Answer:
(c) 1
Question 15.
In the method of rank correlation, what is the sum of differences of the ranks of two variables ?
(a) 0
(b) – 1
(c) 1
(d) Any real number
Answer:
(a) 0
Question 16.
In the method of rank correlation, if the ranks of two variables are exactly in reverse order, then what is the value of r?
(a) r = 0
(b) r = – 1
(c) r = 1
(d) r = 0.1
Answer:
(b) r = – 1
Question 17.
In usual notations, which term is added in Σd2 for each repeated observation in the rank correlation?
(a) \(\frac{m^{2}-1}{12}\)
(b) \(\frac{m^{3}-m}{12}\)
(c) \(\frac{6 m^{3}-m}{12}\)
(d) n(n2 – 1)
Answer:
(b) \(\frac{m^{3}-m}{12}\)
Question 18.
Which kind of correlation will you get between the number of units sold and its revenue at constant price?
(a) Perfect Positive
(b) Partial Positive
(c) Perfect Negative
(d) Partial Negative
Answer:
(a) Perfect Positive
Section B
Answer the following questions in one sentence:
Question 1.
Define correlation.
Answer
If simultaneous changes occur in the values of two related variables due to direct or indirect cause and effect relation, then there exists correlation between the variables.
Question 2.
Define correlation coefficient.
Answer
A numerical measure showing the strength or degree of a linear correlation between two variable is called the correlation coefficient.
Identify, whether there is a positive correlation or negative correlation between the following pairs of variables (Question 3 to Question 6).
Question 3.
The age of an adult person and life insurance premium at the time of taking an insurance under a plan.
Answer
‘Positive correlation’ between the age of an adult person and life insurance premium at the time of taking an insurance under a plan.
Question 4.
The sales and profit of last five years for a mostly accepted product of a company.
Answer
‘Positive correlation’ between the sales and profit of last five years for a mostly accepted production of a company.
Question 5.
The rate of inflation and the purchase power of common man of a country when income of the common man is stable.
Answer
‘Negative correlation’ between the rate of inflation and the purchasing power of common man of country when income of the common man is stable.
Question 6.
Altitude and amount of Oxygen in air.
Answer
‘Negative correlation’ between the Altitude and amount of Oxygen in the air.
Question 7.
What can be said about the correlation between the annual import of crude oil and the number of marriages during the same time period ?
Answer
‘Nonsense correlation’ between the annual Import of crude oil and the number of marriages during the same time period.
Question 8.
The correlation coefficient between X and Y is 0.4. What will be the value of correlation coefficient if 5 is added in each observation of X and 10 is substracted from each observation of Y ?
Answer
r (X, Y) = 0.4. If 5 is added to each observation of X and 10 is subtracted from each observation of y, means r [x + 5, y-10) will also be 0.4, as the value of r is independent of change of origin.
Question 9.
What is the main limitation of scatter diagram method ?
Answer
The main limitation of scatter diagram method is that this method does not give exact degree of correlation between two variables.
Question 10.
If the value of n(n2 – 1) is six times the value of Σd2, then what is the value of r?
Answer
n(n2 – 1) = 6Σd2
Now, r = 1 – \(\frac{6 \Sigma d^{2}}{n\left(n^{2}-1\right)}\)
Putting n(n2 – 1) = 6Σd2
r = 1 – \(\frac{6 \Sigma d^{2}}{6 \Sigma d^{2}}\)
∴ r = 1 – 1 = 0
Hence, the value of r is ‘0’.
Question 11.
What will be the sign of r if the value of the covariance is negative ?
Answer
If the value of the covariance is negative, the sign of r will be negative.
Section C
Answer the following questions as required:
Question 1.
Explain the meaning of positive correlation with an illustration.
Answer:
Meaning of positive correlation: If the changes in the values of two related variables are in the same direction, i.e., if the values of X increases or decreases, the values of Y also increases or decreases, then it is said that there exists positive correlation between the variables X and Y,
Illustration:
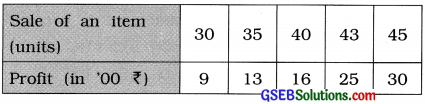
It is clear from the above table that, as the sale of the item increases, the profit earned also increases. So there is positive correlation between the sale of an item and profit.
Question 2.
Explain the meaning of negative correlation with an illustration.
Answer:
Meaning of negative correlation : If the changes in the values of two related variable are in opposite direction, i.e., if the values of X increases/decreases, the values of Y decreases/ increases, then it is said that there exists negative correlation between the variables X and Y.
Illustration:
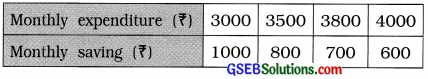
It is clear from the above table that as monthly expenditure increases, the monthly saving decreases. So there is negative correlation between monthly expenditure and monthly saving.
Question 3.
Write the assumptions of Karl Pearson’s method.
Answer:
The assumptions of Karl Pearson’s method are as follows :
- There is linear correlation between two variables.
- There is cause-effect relation between two variables.
Question 4.
Define: Scatter Diagram
Answer:
Showing the values of variable X on X-axis and the values of Y on Y-axis by proper scale, if n ordered pairs (x1, y1), (x2, y2), (xn, yn) of two variables X and Y are plotted on the graph paper, then the diagram obtained is called scatter diagram.
Question 5.
What is spurious correlation ?
Answer:
When two variables are not related by cause-effect relation and there is lack of linear correlation between them, then such correlation is called spurious correlation. For example: There is spurious correlation between the yearly import of crude oil and the number of marriages during the same time period.
Question 6.
Explain the cause and effect relationship.
Answer:
In many situations, simultaneous changes are seen in the values of two variable. If due to changes in the values of one variable, it causes the changes in the values of other variable, then it can be said that the two variables are related by cause-effect relationship. In such cases, change in the value of one variable is ‘cause’ while the change in the value of another variable is ‘effect’.
Such relationship between two variable may be direct or indirect. For example in case of the relation between yearly rainfall and yield of rice of a region. Usually if rainfall increases (cause), yield of rice also increases (effect) and if rainfall decreases, yield of rice also decreases. So there is cause and effect relationship between yearly rainfall and yield of rice in a region.
Question 7.
Explain: Perfect positive correlation
Answer:
If the simultaneous changes occur in the values of the two correlated variables in the same direction and in the same proportion that means if the values of one variable increases / decreased by one unit, then the value of another variable increases / decreases in some constant proportion, the correlation between them is said to be perfect positive correlation.
→ In case of perfect positive correlation, all the points of a scatter diagram lie on the same line going in upward direction from left to right.
→ In case of perfect positive correlation, the value of the correlation coefficient r is 1.
→ For example, the correlation between the number of tickets purchased of a cinema and the price paid is perfect positive correlation. Suppose, 1 ticket cost ₹ 150, we have to pay ₹ 600 for 4 tickets.
Question 8.
Explain: Perfect negative correlation
Answer:
If the simultaneous changes occur in the values of the two correlated variable in the opposite direction and in the same proportion that mean if the values of one variable increases / decreases by one unit, then the values of another variable decreases / increases in same constant proportion, the correlation between them is said to be perfect negative correlation.
→ In case of perfect negative correlation, all the points of a scatter diagram lie on the same line going in the downward direction from left to right.
→ In the case of perfect negative correlation, the value of correlation coefficient is – 1.
→ For example; the correlation between the height of a place from sea level and the proportion of oxygen in the air is perfect negative correlation. More and more height of a place from sea level the proportion of oxygen in the air becomes less and less.
Question 9.
When is it necessary to use rank correlation ?
Answer:
In the following circumstances it is necessary to use rank correlation:
- When the related variables are of qualitative nature like honesty, punctuality, beauty, etc. where ranks are assigned according to their proficiency.
- When the values of related variables are large and there is more dispersion in their values.
Question 10.
In which situation, the values of Karl Pearson’s correlation coefficient and Spearman’s rank correlation coefficient are equal ?
Answer:
When the values of two variables are some arrangement of first n natural numbers, the correlation coefficients obtained by Karl Pearson’s method and Spearman’s method are equal.
Question 11.
Find the value of r if Cov (x, y) = 120, Sx = 12, Sy = 15.
Answer:
Here, Cov (x, y) = 120, Sx = 12, Sy = 15.
Now, r = \(\frac{{Cov}(x, y)}{\mathrm{S}_{x} \cdot \mathrm{S}_{y}}\) = \(\frac{120}{12 \times 15}\) = \(\frac{120}{180}\) = 0.67
Question 12.
Find the value of r if Σ(x – x̄) (y – ȳ) = – 65, Sx = 3, Sy = 4 and n = 10.
Answer:
Here Σ(x – x̄) (y – ȳ) = – 65, Sx = 3, Sy = 4 and n = 10.
Now, r = \(\frac{\Sigma(x-\bar{x})(y-\bar{y})}{n \cdot S_{x} \cdot S_{y}}\)
= \(\frac{-65}{10 \times 3 \times 4}\)
= \(\frac{-65}{120}\)
= – 0.54
Question 13.
For 10 pairs of observations, Σd2 = 120. Find the value of the rank correlation coefficient.
Answer:
Here, n = 10; Σd2 = 120
Now, r = 1 – \(\frac{6 \Sigma d^{2}}{n\left(n^{2}-1\right)}\)
= 1 – \(\frac{6(120)}{10(100-1)}\)
= 1 – \(\frac{720}{10 \times 99}\)
= 1 – \(\frac{720}{990}\)
= 1 – 0.73
= 0.27
∴ r = 0.27
Section D.
Answer the following questions as required:
Question 1.
Explain scatter diagram method.
Answer:
Scatter diagram method is a most widely used method for determining the nature (type) of correlation between two related variables.
→ When ordered pairs of n values of two variables X and Y, then taking the values of variable X on X-axis and the values of variable Y on Y-axis, points corresponding to pairs (x1, y1), (x2, y2), …….. (xn, yn) are plotted on the graph paper by taking proper scale. The graph showing the plotted points is called a scatter diagram.
→ The pattern of points on a scatter diagram shows the nature or type of correlation and the degree or strength of correlation up to some extent.
(1)
If all the points of a scatter diagram lie on one line going in the upward direction from left to right, then it shows perfect Positive correlation between two variables X and Y.
(2)
If all the points of a scatter diagram lie on one line going in the downward direction from left to right, then it shows perfect negative correlation between two variables X and Y.
(3)
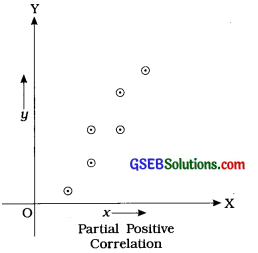
If all the points of a scatter diagram are not on one line but lie around a line going in upward direction from left to right, then it shows partial positive correlation between two variables X and Y.
(4)
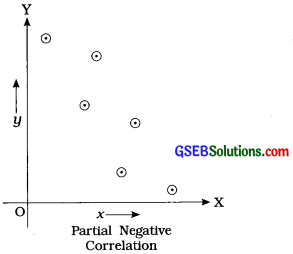
If all the points of a scatter diagram are not on one line but lie around a line going in downward direction from left to right, then it shows partial negative correlation between two variables X and Y.
(5)
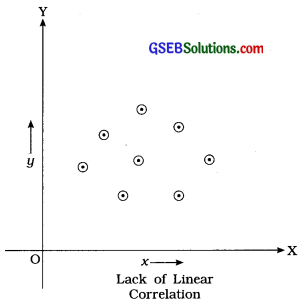
If the points of a scatter diagram lie randomly without forming a specific pattern, then it shows lack (absense) of linear correlation between two variables X and Y.
Question 2.
Write merits and limitations of scatter diagram method.
Answer:
Merits of scatter diagram are as follows :
- Scatter diagram is a simple method to know the nature of correlation between two variables.
- It requires only the knowledge of plotting the points and the mathematical knowledge is required less.
- Up to some extent it gives idea about the strength of correlation between the variable.
- The patterns of the points on a scatter diagram.suggests whether the correlation is linear or not.
- The presence of some pairs of extrem observations does not arise any difficulty in judging the nature of correlation between the variable.
The limitations of scatter diagram are as follows:
- It does not give exact degree of correlation between two variables.
- It is not useful method of studying correlation between classified bivariate data.
Question 3.
Write the properties of correlation coefficient.
Answer:
The properties of correlation coefficient are as follows :
- The value of correlation coefficient r lies in the interval – 1 to 1. i.e., – 1 ≤ r ≤ 1.
- The correlation coefficient r is free from unit of measurement, i.e., it does not have any unit of measurement.
- The correlation coefficient between variables X and Y is same as that of between Y and X, i.e., r (x, y) = r (y, x).
- The value of correlation coefficient r does not change with the change of origin and scale, i.e., r (x, y) = r (u, v) where, u = \(\frac{x-\mathrm{A}}{\mathrm{C}_{x}}\); v = \(\frac{y-\mathrm{B}}{\mathrm{C}_{y}}\). Cx > 0, Cy > 0 and A, B, Cx, Cy are constant.
- The correlation coefficient r is an absolute measure.
- If the sign of any one of two variables is changed then the sign of the correlation coefficient also changes, i.e., r(-x, y) = -r(x, y); r (x, – y) = – r (x, y)
- If the signs of both the variables are changed then the sign of the correlation remain unchanged, i.e., r(- x, – y) = r(x, y).
Question 4.
Write the merits and limitations of Karl Pearson’s method.
Answer:
Merits of Karl Pearson’s Method : The merits of Karl Pearson’s method are as follows:
- The nature as well as the degree of correlation between two variables can be known by this method.
- This is the most popular method of measuring linear correlation between two variables.
- It summarises the degree of correlation in a single number.
Limitations of Karl Pearson’s Method: The
limitations of Karl Pearson’s method are as follows:
- It depends on the assumption of linear correlation between two variables.
- The value of r obtained by this method is highly affected by the extreme values.
- Utmost care is required to interprete the value of r obtained by this method. Otherwise it leads to misunderstanding.
Question 5.
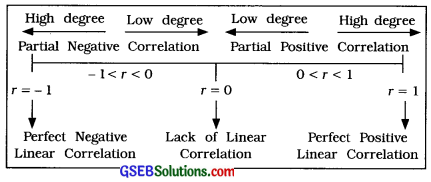
Interpret r = 1, r = – 1 and r = 0.
Answer:
r = 1 : There is perfect positive correlation between two variables. When increase / decrease in the value of one variable results in increase / decrease in the value of the other variable in constant proportion then the value of r is 1. In scatter diagram all points lie on the same straight line going in upward direction from left to right.
r = – 1 : There is perfect negative correlation between two variables. When increase / decrease in the value of the variable results decrease / increase in the value of the other variable in constant proportion, then the value of r is – 1. In scatter diagram all point lie on the same straight line going in downward direction from left to right.
r = 0 : There is no linear correlation between two variables, r = 0 shows absence of correlation and hence two variables are said to be linearly uncorrelated. In scatter diagram all points are randomly scattered. When r = 0 we can say only lack of linear correlation between two variables but there may be non-linear correlation between the variables.
Question 6.
Explain Spearman’s rank correlation method.
Answer:
The qualitative variables or attributes cannot be measured numerically but they can be ranked serially according to their proficiency. The correlation coefficient computed using such ranks of two attributes as suggested by Spearman is called Spearman’s rank correlation coefficient.
→ Even if the related data is of quantitative nature, the rank correlation coefficient is obtained by assigning the ranks to the numerical observations according to their magnitudes.
→ Suppose the ranks for n pairs of observations of two variable characteristics are (Rxi, Ryi;); where i = 1, 2, …, n.
→ The following formula is used to find the rank correlation coefficient:
r = 1 – \(\left\{\frac{6 \Sigma d^{2}}{n\left(n^{2}-1\right)}\right\}\)
Where, d = Rx – Ry; n = No. of pairs
→ When values of observations of X or Y are equal, we say that it is a tie. In such a case, average of corresponding ranks is assigned as
rank to each of the repeated observation in the tie and the next observation will get the rank next to the last rank used in calculating the average rank.
→ When a tie occurs, the formula for obtaining rank correlation coefficient is as follows:
r = 1 – \(\frac{6\left(\Sigma d^{2}+C F\right)}{n\left(n^{2}-1\right)}\)
Where, CF = Σ\(\left(\frac{m^{3}-m}{12}\right)\)
m = No. of repetition of observation
→ When the values of two variables are some arrangements of first n natural numbers, the correlation coefficient obtained by Karl Pearson’s method and Spearman’s method are equal.
Question 7.
Write merits and limitations of Spearman’s rank correlation method.
Answer:
Merits of Spearman’s rank correlation method : The merits of Spearman’s rank correlation method are as follows:
- This method is easy to understand.
- In calculating correlation coefficient, this method is easier than that of Karl Pearson’s method.
- When the related data is qualitative, this is the only method to find the measure of correlation.
- When there is more dispersion in the related numerical data or the extreme observations are present in the data, Spearman’s method is preferred than Karl Pearson’s method.
Limitations: Following are the limitations of Spearman’s rank correlation method:
- This method does not provide accurate measure of correlation coefficient as compared to Karl Pearson’s method.
- It is tedious to assign ranks when the number of observations is large.
- This method cannot be used for a bivariates frequency distribution.
Question 8.
How would you interpret partial correlation ?
Answer:
If the value of r is between 0 and 1 or between – 1 and 0, i.e., if |r| < 1, then we can say that there is a partial (imperfect) correlation between two variables.
→ When the value of |r| is nearer to 1, we can say that the relationship between two variables is close to perfect linear correlation and there is high degree of the relationship.
In such a case a reliable estimate of changes in the value of one variable corresponding to changes in the value of other variable can be obtained.
→ When the value of |r| is nearer to 0, we can say that, the degree of the linear relationship is very less and there is almost lack of linear correlation between two variables. In such a case we cannot obtain a reliable estimate of the changes in the values of one variable corresponding to changes in the value of the other variable.
Question 9.
State the necessary precautions to be taken while interpreting the value of correlation coefficient.
Answer:
The necessary precautions to be taken while interpreting the value of correlation coefficient are as follows:
1. Nonsense or Spurious Correlation: The value off correlation coefficient r does not indicate cause-effect relation or any other meaningful correlation between two variables. For example, if we compute the correlation coefficient between the number of doctors (X) in a government hospital and the number of patients (Y) died during the treatment in certain time period, than the value of r may be near to 1. But there cannot be meaningful relation between X and Y, because it cannot be said that as the number of doctor increases, the number of patients died during the treatment also increases.
This may happen due to other factors. So it is not meaningful correlation between X and Y. Thus, the interpretation based on only the value of r may be misleading. Hence, we should consider the assumption of cause-effect relation between the variables. We should be careful to interpret about the nature and closeness of correlation between the variables.
2. Sometimes due to the presence of other factors the value of (r) may be close to 1, though two variables are not correlated.
3. Lack of correlation : When the value of r is zero (0). We can merely say that there is no linear correlation or lack of linear correlation between two variables. There may be a non-linear correlation between the variables. Hence, when r = 0, it is not proper to say that there is no correlation between two variables.
4. If the correlation coefficient computed for the data which is related to a given region or class or given period, then its interpretation should be limited to that region or class or time period only, otherwise it will mislead.
Question 10.
The following data is available for two variables rainfall in mm (X) and yield of crop Qtl/ Hectare (Y):
n = 10, x̄ = 120, ȳ = 150, Sx = 30, Sy = 40 and Σxy = 189000.
Find the correlation coefficient.
Answer:
Here, n = 10; x̄ = 120; ȳ = 150; Sx = 30; Sy = 40 and Σxy = 189000 are given.
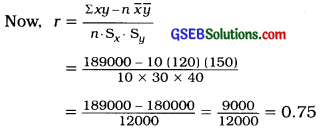
Hence, the correlation coefficient obtained is 0.75.
Question 11.
The following information is obtained for 9 pairs of observations:
Σx = 51, Σy = 72, Σx2 = 315, Σy2 = 582, Σxy = 408. Find the correlation coefficient.
Answer:
Here, n = 9; Σx = 51, Σy = 72, Σx2 = 315, Σy2 = 582 and Σxy = 408 are given.
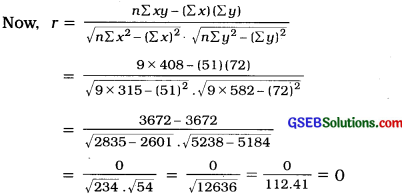
Hence, the correlation coefficient obtained is 0.
Question 12.
The information obtained on the basis of ranks given by two judges to eight contestants of a dance competition is given below:
Σ(Rx – Ry)2 = 126
Where, Rx and Ry are the ranks given to a constant by the two judges respectively.
Find Spearman’s rank correlation coefficient.
Answer:
Here, n = 8 and Σ(Rx – Ry)2 = Σd2 = 126 are given.
Spearman’s Correlation Coefficient:
Now, r = 1 – \(\frac{6 \Sigma d^{2}}{n\left(n^{2}-1\right)}\)
= 1 – \(\frac{6 \times 126}{8\left(8^{2}-1\right)}\)
= 1 – \(\frac{756}{8(64-1)}\)
= 1 – \(\frac{756}{504}\)
= 1 – 1.5
= – 0.5
Hence, Spearman’s rank correlation coefficient obtained is – 0.5.
Question 13.
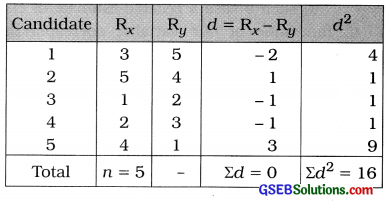
The ranks given by two experts on the basis of interviews of five candidates for a job are (3, 5), (5, 4), (1, 2), (2, 3) and (4, 1). Find the rank correlation coefficient from this data.
Answer:
Here, n = 5; Rx = Ranks by first expert; Ry = Ranks by second expert.
The table for calculating rank correlation coefficient is prepared as follows:
Rank Correlation Coefficient:
Now, r = 1 – \(\frac{6 \Sigma d^{2}}{n\left(n^{2}-1\right)}\)
Putting n = 5 and Σd2 =16 in the formula,
r = 1 – \(\frac{6 \times 16}{5\left(5^{2}-1\right)}\)
= 1 – \(\frac{96}{5(25-1)}\)
= 1 – \(\frac{96}{120}\)
= 1 – 0.8
= 0.2
Hence, the rank correlation coefficient obtained is 0.2.
Section E
Solve the following:
Question 1.
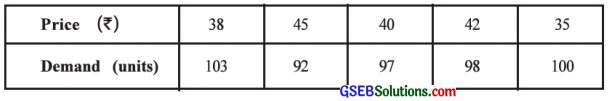
The following information is obtained to study the relation between the selling price of nose mask and its demand during an epidemic:
Find the correlation coefficient between the price and demand of mask by Karl Pearson’s method.
Answer:
Here, n = 5; x = Price; y = Demand
Now, x̄ = \(\frac{\Sigma x}{n}\) = \(\frac{200}{5}\) = ₹ 40;
y = \(\frac{\Sigma y}{n}\) = \(\frac{490}{5}\) = 98 units
x̄ and ȳ are integer. So the table for calculating r is prepared as follows:
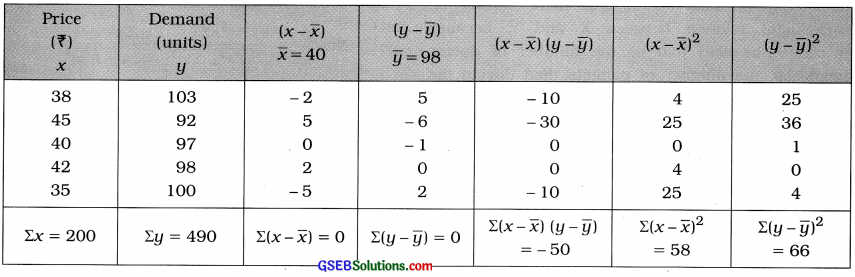
Correlation Coefficient:
Now, r = \(\frac{\sum(x-\bar{x})(y-\bar{y})}{\sqrt{\sum(x-\bar{x})^{2}} \cdot \sqrt{\sum(y-\bar{y})^{2}}}\)
Putting Σ(x – x̄) (y – ȳ) = – 50, Σ(x – x̄)2 Σ(y – ȳ)2 = 66 in the formula,
r = \(\frac{-50}{\sqrt{58} \cdot \sqrt{66}}\)
= \(\frac{-50}{\sqrt{3828}}\)
= \(\frac{-50}{61.87}\)
= – 0.81
Hence, the correlation coefficient between the price and demand of mask obtained is – 0.81.
Question 2.
In order to study the relationship between the abilities in the subjects of Human Resource Management and Personality Development for the students of a post graduate level course, a sample of 5 students is taken and the following information is obtained:
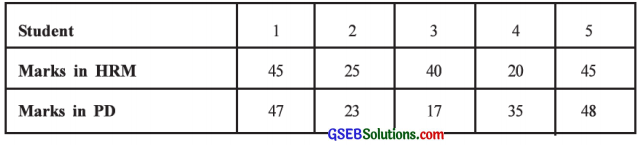
Calculate the Karl Pearson’s correlation coefficient between the marks of both the subjects.
Answer:
Here, n = 5; x = Marks in HRM; y = Marks in PD
Now, x̄ = \(\frac{\Sigma x}{n}\) = \(\frac{175}{5}\) = 35 marks; ȳ = \(\frac{\Sigma y}{n}\) = \(\frac{170}{5}\) = 34 marks
x̄ and ȳ are integer. So the table for calculating r is prepared as follows:
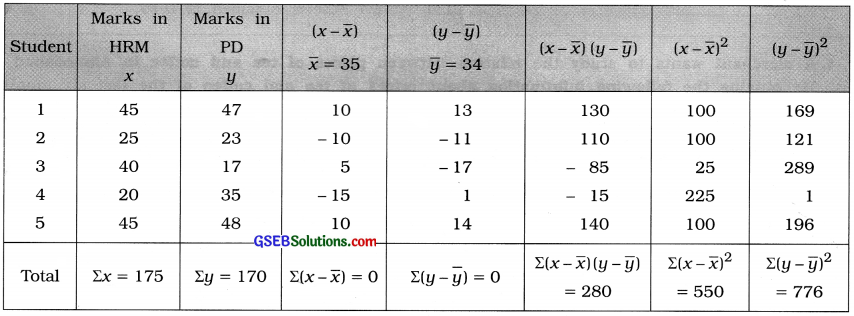
Correlation Coefficient:
r = \(\)
Putting Σ(x – x̄) (y – ȳ) = 280, Σ(x – x̄)2 = 550 and Σ(y – ȳ)2 = 776 in the formula,
r = \(\frac{280}{\sqrt{550} \cdot \sqrt{776}}\)
= \(\frac{280}{\sqrt{426800}}\)
= \(\frac{280}{653.30}\)
= 0.43
Hence, the correlation coefficient between the marks of both HRM and PD obtained is 0.43.
Question 3.
A vendor wants to display lipsticks of different brands according to their popularity. For that, he invites two experts Preyal and Nishi to rank the lipsticks of different brands:
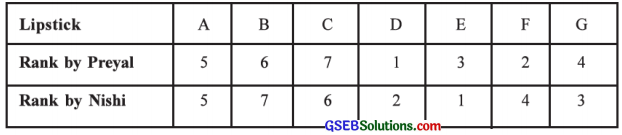
Find the rank correlation coefficient to know the smilarity in the decision of both the experts.
Answer:
Here, n = 7; Rx = Rank by Preyal and Ry = Rank by Nishi.
The table for calculating rank correlation coefficient is prepared as follows:
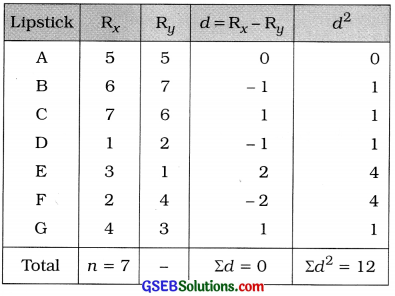
Rank Correlation Coefficient:
r = 1 – \(\frac{6 \Sigma d^{2}}{n\left(n^{2}-1\right)}\)
Putting n = 7 and Σd2 = 12 in the formula,
r = 1 – \(\frac{6(12)}{7\left(7^{2}-1\right)}\)
= 1 – \(\frac{72}{7(49-1)}\)
= 1 – \(\frac{72}{336}\)
= 1 – 0.21
= 0.79
Hence, the rank correlation coefficient between two experts obtained is 0.79.
Question 4.
A merchant wants to study the relation between prices of tea and coffee in Ahmedabad city. He obtains the following information about prices of tea and coffee of the last six months:
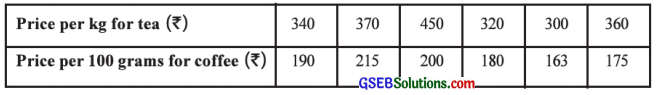
Calculate the rank correlation coefficient between the price of tea and coffee.
Answer:
Here, n = 6; Rx = Ranks for tea (x) and Ry = Rank for coffee (y).
The table for calculating the rank correlation coefficient is prepared as follows:
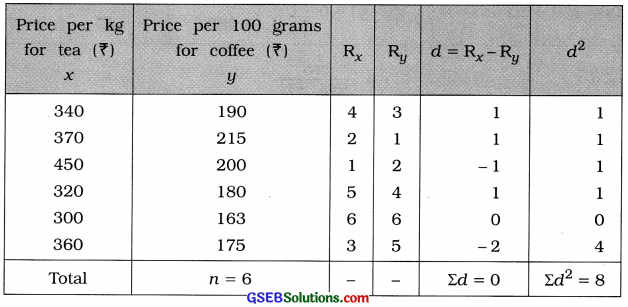
Rank Correlation Coefficient:
r = 1 – \(\frac{6 \Sigma d^{2}}{n\left(n^{2}-1\right)}\)
Putting n = 6 and Σd2 = 8 in the formula,
r = 1 – \(\frac{6(8)}{6\left(6^{2}-1\right)}\)
= 1 – \(\frac{48}{6(36-1)}\)
= 1 – \(\frac{48}{210}\)
= 1 – 0.23
= 0.77
Hence, the rank correlation coefficient between the price of tea and coffee obtained is 0.77.
Question 5.
The demand of an imported fruit in a local market is very uncertain. To know the relation between the price of the fruit and its supply, a vendor collects the information about the average price and supply for last ten months:
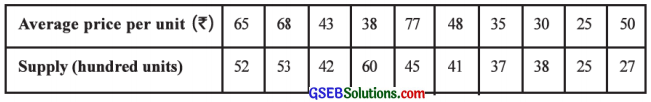
Find the rank correlation between the average price and the supply.
Answer:
Here, n = 10; Rx = Ranks for average price per unit (x) and Ry = Ranks for supply (y).
The table for calculation the rank correlation coefficient is prepared as follows:
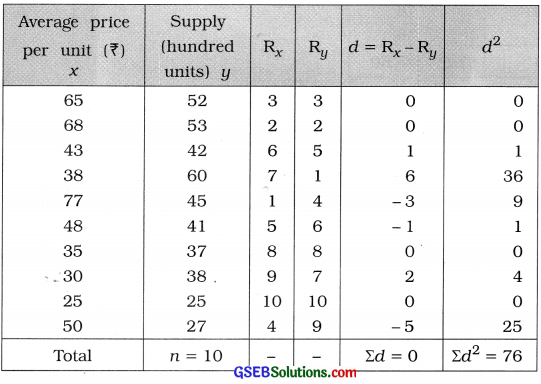
Rank Correlation Coefficient:
r = 1 – \(\frac{6 \Sigma d^{2}}{n\left(n^{2}-1\right)}\)
Putting n = 10 and Σd2 = 76 in the formula,
r = 1 – \(\frac{6(76)}{10\left(10^{2}-1\right)}\)
= 1 – \(\frac{456}{10(100-1)}\)
= 1 – \(\frac{456}{990}\)
= 1 – 0.46
= 0.54
Hence the rank correlation coefficient between the average price and the supply obtained is 0.54.
Question 6.
To know the relation between the results of the Tests taken in a span of short time, a teacher has conducted two Tests in last two weeks and the ranks obtained by seven students are as follows:
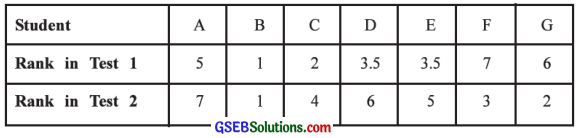
Find the rank correlation coefficient to know the similarity between the results of two examinations.
Answer:
Here, n = 7; Rx = Ranks in Test 1; Ry = Ranks in Test 2.
In test 1 rank 3.5 comes twice. So CF is calculated.
The table for calculating the rank correlation coefficient is prepared as follows:
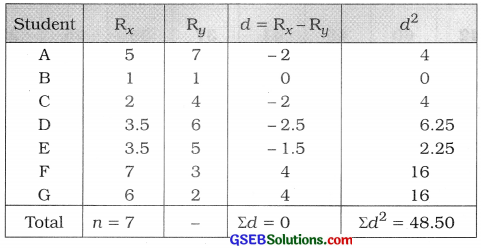
Rank Correlation Coefficient:
CF = \(\frac{m^{3}-m}{12}\). Here, m = 2
∴ CF = \(\frac{8-2}{12}\) = \(\frac{6}{12}\) = 0.5
r = 1 – \(\frac{6\left[\Sigma d^{2}+\mathrm{CF}\right]}{n\left(n^{2}-1\right)}\)
Putting n = 7; Σd2 = 48.50 and CF = 0.5 in the formula,
r = 1 – \(\frac{6(48.5+0.5)}{7\left(7^{2}-1\right)}\)
= 1 – \(\frac{6(49)}{7(49-1)}\)
= 1 – \(\frac{294}{336}\)
= 1 – 0.875
= 0.125 ≈ 0.13
Hence the rank correlation coefficient between the results of two tests obtained is 0.13.
Section F
Solve the following:
Question 1.
The information of fertilizer used (in tons) and productivity (in tons) of eight districts is given below:
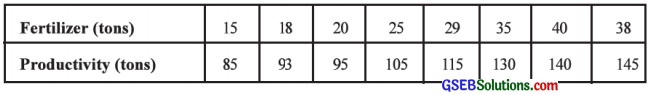
Calculate the correlation coefficient by Karl Pearson’s method.
Answer:
Here, n = 8; x = Fertilizer; y = Productivity
Now, x̄ = \(\frac{\Sigma x}{n}\) = \(\frac{220}{8}\) = 27.5 tons; ȳ = \(\frac{\Sigma y}{n}\) = \(\frac{908}{8}\) = 113.5 tons
x̄ and ȳ are not integers and the values of x and y are large. So we calculate r by shortcut method.
We obtain new variables u = x – A, A = 27 and v = y – B, B = 113.
The table for calculating r is prepared as follows:
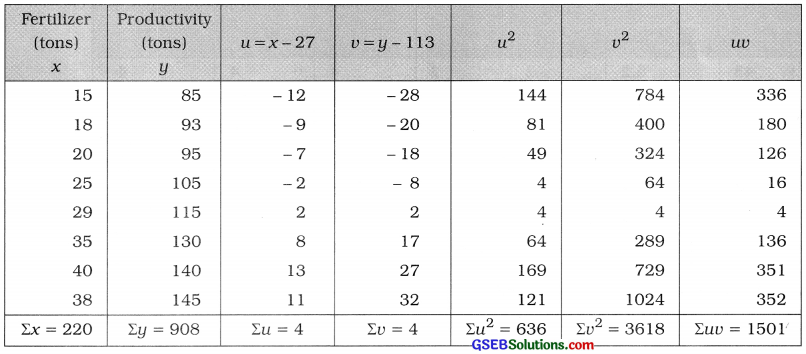
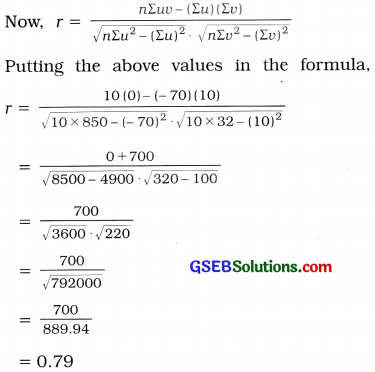
Now, r = \(\frac{n \Sigma u v-(\Sigma u)(\Sigma v)}{\sqrt{n \Sigma u^{2}-(\Sigma u)^{2}} \cdot \sqrt{n \Sigma v^{2}-(\Sigma v)^{2}}}\)
Putting n = 8, Σuv = 1501, Σu = 4, Σv = 4, Σu2 = 636 and Σv2 =3618 in the formula,
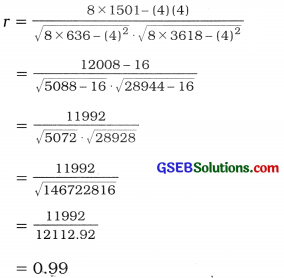
Hence, the correlation coefficient by Karl Pearson’s method obtained is 0.99.
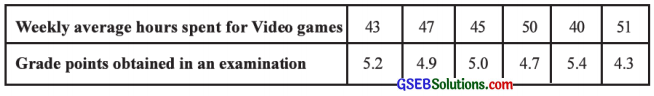
Question 2.
Find the Karl Pearson’s correlation coefficient from the following information of the average weekly hours spent on Video games and the grade points obtained in an examination by 6 children of a big city.
Answer:
Here, n = 6, x = Weekly average hours spent for Video games and y = Grade points obtained in an examination
Now, x̄ = \(\frac{\sum x}{n}\) = \(\frac{276}{6}\) = 46 hours; ȳ = \(\frac{\Sigma y}{n}\) = \(\frac{29.5}{6}\) = 4.92 grade points
We calculate r by shortcut method taking new variables u = x – A, A = 45 and u = \(\frac{y-\mathrm{B}}{\mathrm{C}_{y}}\) = \(\frac{y-5}{0.1}\)
The table for calculating the karl pearson’s correlation coefficient is prepared as follows;
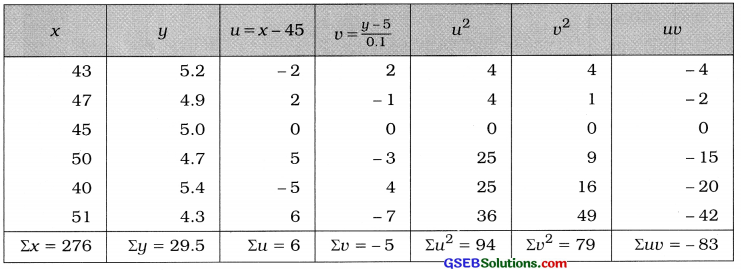
Karl Pearson’s correlation coefficient:
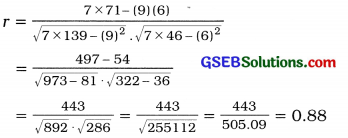
Now, r = \(\frac{n \Sigma u v-(\Sigma u)(\Sigma v)}{\sqrt{n \Sigma u^{2}-(\Sigma u)^{2}} \cdot \sqrt{n \Sigma v^{2}-(\Sigma v)^{2}}}\)
Putting n = 6, Σuv = – 83, Σu = 6, Σv = – 5, Σu2 = 94 and Σv2 = 79 in the formula,
Hence, the Karl Pearson’s correlation coefficient obtained is – 0.96.
Question 3.
Find Karl Pearson’s correlation coefficient between density of population (per square km) and death rate (per thousand) from the following data:
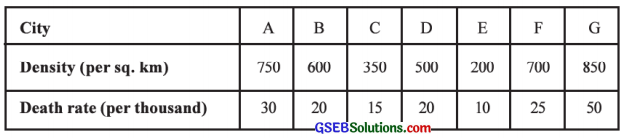
Answer:
Here, n = 7: x = Density, y = Death rate.
We calculate the correlation coefficient by shortcut method obtaining new variables u and v and the table for calculation is prepared as follows:
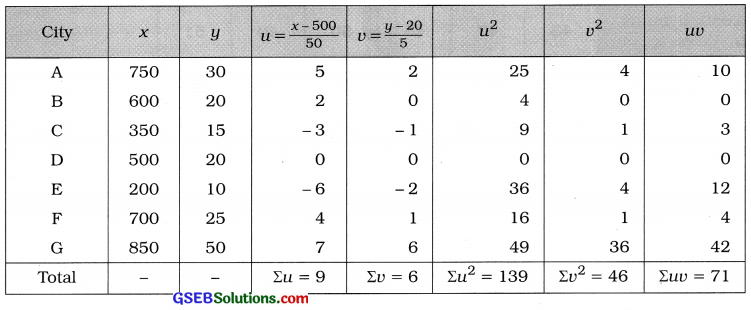
Karl Pearson’s correlation coefficient:
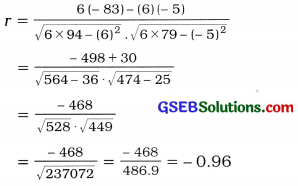
Now, r = \(\frac{n \Sigma u v-(\Sigma u)(\Sigma v)}{\sqrt{n \Sigma u^{2}-(\Sigma u)^{2}} \cdot \sqrt{n \Sigma v^{2}-(\Sigma v)^{2}}}\)
Putting n = 7, Σuv = 71, Σu = 9, Σv = 6, Σu2 = 139 and Σv2 = 46 in the formula,
Hence, Karl Pearson’s correlation coefficient between density of population and death rate obtained is 0.88.
Question 4.
The following information is obtained to study the relationship between the advertisement cost and the sales of electric fans of the companies manufacturing electric fans. Find the correlation coefficient between advertisement cost and the sales by Karl Pearson’s method:
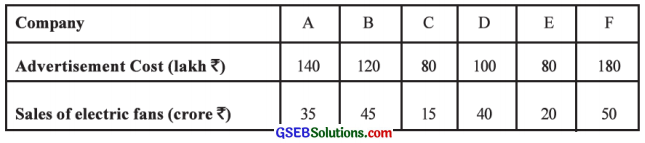
Answer:
Here, n = 6; x = Advertisement cost; y = Sales of electric fans
We calculate r by shortcut method obtaining new variables u = \(\frac{x-\mathrm{A}}{\mathrm{C}_{x}}\) = \(\frac{x-100}{20}\) and v = \(\frac{y-\mathrm{B}}{\mathrm{C}_{y}}\) = \(\frac{y-35}{5}\).
The table for calculating r is prepared as follows :
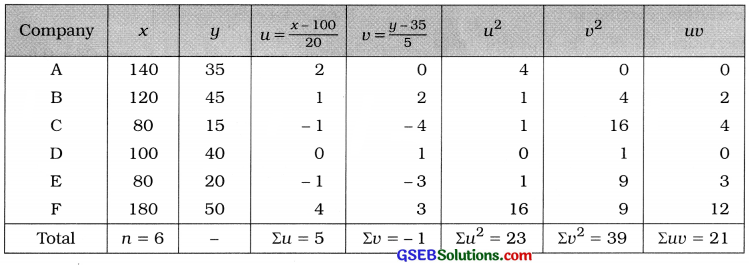
Karl Pearson’s correlation coefficient:
Now, r = \(\frac{n \Sigma u v-(\Sigma u)(\Sigma v)}{\sqrt{n \Sigma u^{2}-(\Sigma u)^{2}} \cdot \sqrt{n \Sigma v^{2}-(\Sigma v)^{2}}}\)
Putting n = 6, Σuv= 21, Σu = 5, Σv = – 1, Σu2 = 23 and Σv2 = 39 in the formula,
r = \(\frac{6(21)-(5)(-1)}{\sqrt{6 \times 23-(5)^{2}} \cdot \sqrt{6 \times 39-(-1)^{2}}}\)
= \(\frac{126+5}{\sqrt{138-25} \cdot \sqrt{234-1}}\)
= \(\frac{131}{\sqrt{113} \cdot \sqrt{233}}\)
= \(\frac{131}{\sqrt{26329}}\)
= \(\frac{131}{162.26}\)
Hence, the correlation coefficient between advertisement cost and the sales of electrics fans obtained is 0.81.
Question 5.
A doctor obtains the following information for the weights of seven mothers and their children from a maternity home for his research to know the relation between the weights of mother and weights of their children at the time of birth:
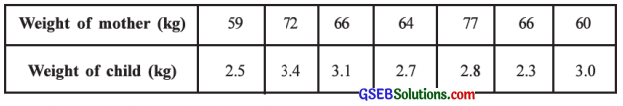
Find rank correlation coefficient between the weights of mother and child.
Answer:
Here, n = 7; x = Weight of mother; y = Weight of child
Rx = Rank of weight of mother, Ry = Rank of weight of child
The table for calculating the rank correlation coefficient is prepared as follows:
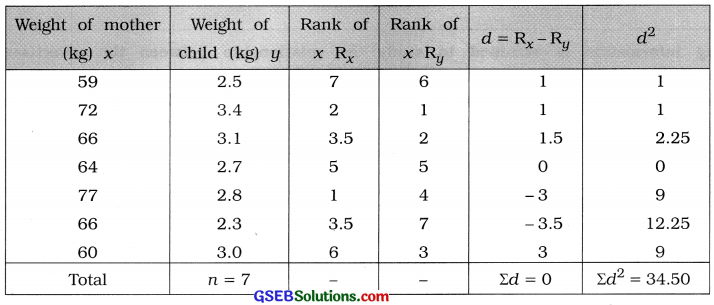
Rank correlation coefficient:
Here, observation 66 of x is repeated twice.
So CF is calculated as follows:
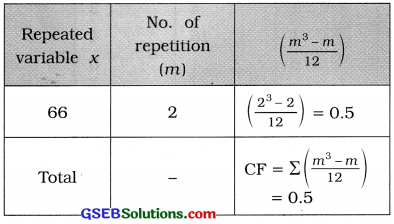
Now, r = 1 – \(\frac{6\left(\Sigma d^{2}+\mathrm{CF}\right)}{n\left(n^{2}-1\right)}\)
Putting n = 7, Σd2 = 34.5 and CF = 0.5 in the formula,
r = 1 – \(\frac{6(34.5+0.5)}{7\left(7^{2}-1\right)}\)
= 1 – \(\frac{6(35)}{7(49-1)}\)
= 1 – \(\frac{210}{336}\)
= 1 – 0.62
= 0.38
Hence, the rank correlation coefficient between the weights of mother and child obtained is 0.38.
Question 6.
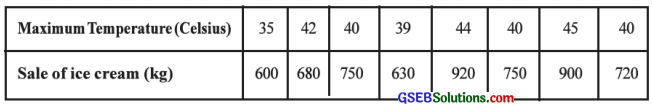
The following data is obtained to know the relation between maximum day temperature and the sale of ice cream in Ahmedabad city:
Calculate the rank correlation coefficient.
Answer:
Here, n = 8; x = Maximum temperature; y = Sale of ice cream
Rx = Ranks for x and Ry = Ranks for y
The table for calculating the rank correlation coefficient is prepared as follows:
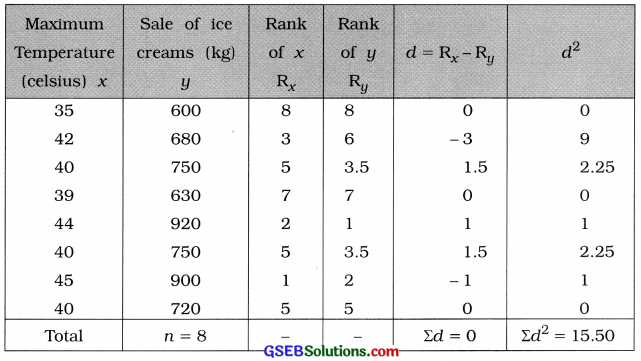
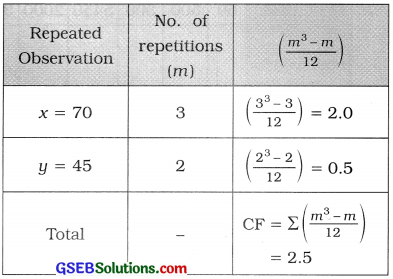
Rank correlation coefficient:
Here, observation 40 on x is repeated thrice and 750 of y is repeated twice. So CF is calculated as follows :
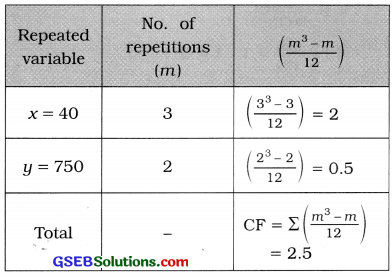
Now, r = 1 – \(\frac{6\left(\Sigma d^{2}+\mathrm{CF}\right)}{n\left(n^{2}-1\right)}\)
Putting n = 8, Σd2 = 15.5 and CF = 2.5 in the formula,
r = 1 – \(\frac{6(15.5+2.5)}{8\left(8^{2}-1\right)}\)
= 1 – \(\frac{6(18)}{8(64-1)}\)
= 1 – \(\frac{108}{504}\)
= 1 – 0.21
= 0.79
Hence, the rank correlation coefficient between maximum temperature and sale of ice cream obtained is 0.79.
Question 7.
An entrance test required to study abroad is conducted online. The marks obtained in Reasoning Ability and English Speaking in this online test (having negative marking system for wrong answer) by 5 students selected in a sample are given below:
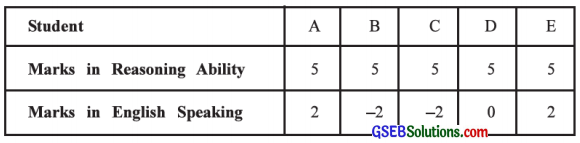
Find the rank correlation coefficient between Reasoning Ability and ability in English Speaking.
Answer:
Here, n = 5; x = Marks in Reasoning Ability and y = Marks in English Speaking
Rx, = Ranks for x and Ry = Ranks for y.
The table for calculating the rank correlation coefficient is prepared as follows :
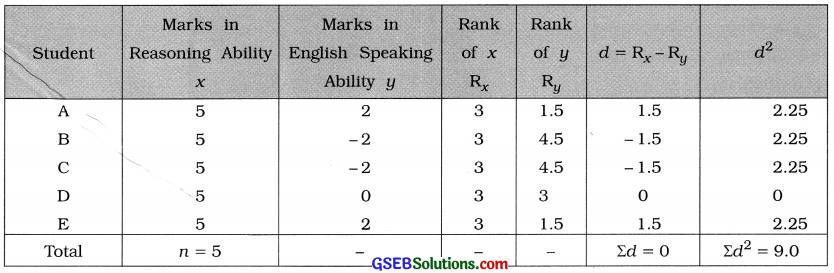
Rank correlation coefficient: Here, observation 5 of variable x is repeated for five times and to y, 2 is repeated twice and – 2 is repeated twice. So the CF is calculated as follows:
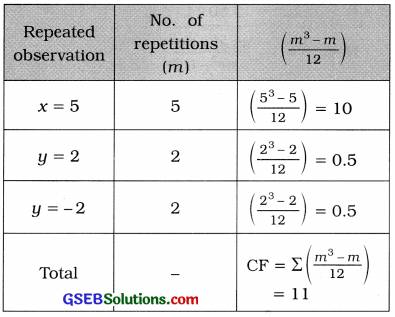
Now, r = 1 – \(\frac{6\left(\Sigma d^{2}+\mathrm{CF}\right)}{n\left(n^{2}-1\right)}\)
Putting n = 5, Σd2 = 9 and CF = 11 in the formula,
r = 1 – \(\frac{6(9+11)}{5\left(5^{2}-1\right)}\)
= 1 – \(\frac{6(20)}{5(25-1)}\)
= 1 – \(\frac{120}{120}\)
= 1 – 1
= 0
Hence, the rank correlation coefficient between the judgement of the two Gurus obtained is 0.6.
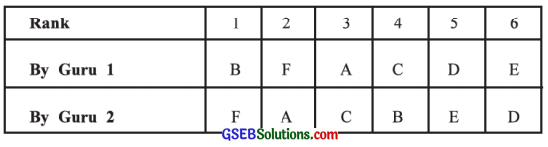
Question 8.
Six dancers A, B, C, D, E and F in a dance competition were judged by two dance Gurus. The ranks assigned to the dancers are as follows:
Find the rank correlation coefficient between the judgement of the two Gurus.
Answer:
Here, n = 6; Rx = Rank by Guru 1 and Ry = Rank by Guru 2.
The table for calculating the rank correlation coefficient is prepared as follows :
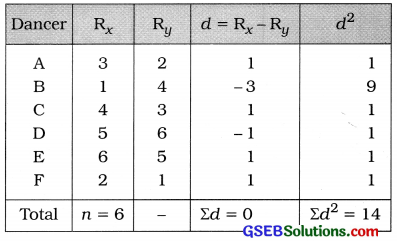
Rank correlation coefficient:
Now, r = 1 – \(\frac{6\left(\Sigma d^{2}+\mathrm{CF}\right)}{n\left(n^{2}-1\right)}\)
Putting n = 6, Σd2 = 14 in the formula,
r = 1 – \(\frac{6(14)}{6\left(6^{2}-1\right)}\)
= 1 – \(\frac{84}{6(36-1)}\)
= 1 – \(\frac{84}{210}\)
= 1 – 0.4
= 0.6
Question 9.
The following data is obtained for two variables, inflation (X) and interest rate (Y) :
n = 50, Σx = 500, Σy = 300, Σx2 = 5450, Σy2 = 2000, Σxy = 3090
Later on, it was known that one pair of observation (10, 6) was included additionally by mistake. Find the correlation coefficient by excluding this pair of observations.
Answer:
Here, n – 50; Σx = 500; Σy = 300; Σx2 = 5450; Σy2 = 2000 and Σxy = 3090
A pair of observation (10, 6) is to be deleted. We find the corrected values as shown in the following table:
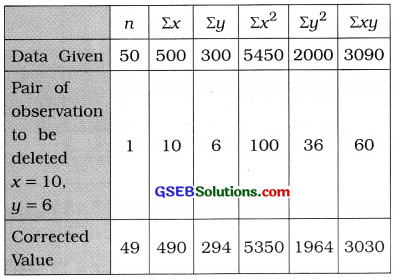
Putting all these corrected value in the following formula, we get
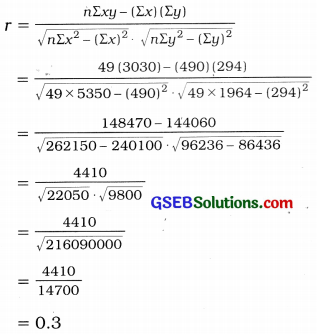
Hence, the correlation coefficient obtained is 0.3.
Question 10.
The information regarding sales (X) and expenses (Y) of 10 firms is given below:
x̄ = 58, ȳ = 14, Σ(x – 65)2 = 850,
Σ(y – 13)2 = 32, Σ(x – 65) (y – 13) = 0
Find the correlation coefficient.
Answer:
Here, h = 10; x̄ = 58; ȳ = 14, Σ(x – 65)2 = 850, Σ(y – 13)2 = 32, Σ(x – 65) (y – 13) = 0,
x̄ = 58 ∴ u = x – 65
![]()
= nx̄ – 650
= (10 × 58) – 650
= 580 – 650 = – 70
ȳ = 14 ∴ v = y – 13
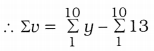
= nȳ – 130
= (10 × 14) – 130
= 140 – 130 = 10
Σu2 = Σ(x – 65 )2 = 850
Σv2 = Σ(y – 13)2 = 32
Σuv = Σ(x – 65) (y – 13) = 0
n = 10
Hence, the correlation coefficient obtained is 0.79.
Question 11.
Daily calorie intake of ten persons is X and their weight is Y kg. The rank correlation coefficient from this information is 0.6. On subsequent verification, it was noticed that the difference of ranks of X and Y for one of the persons was taken as 2 instead of 4. Find the correct value of rank correlation coefficient.
Answer:
Here, n = 10, r = 0.6
Correct difference of ranks d = 4
Wrong difference of ranks d = 2
Now, r = 1 – \(\frac{6 \Sigma d^{2}}{n\left(n^{2}-1\right)}\)
∴ 0.6 = 1 – \(\frac{6 \Sigma d^{2}}{10\left(10^{2}-1\right)}\)
∴ 0.6 – 1 = \(\frac{6 \Sigma d^{2}}{10(100-1)}\)
∴ – 0.4 = – \(\frac{6 \Sigma d^{2}}{990}\)
∴ 6Σd2 = 0.4 × 990 = 396
∴ Σd2 =\(\frac{396}{6}\) = 66
Correct Σd2 = 66 – (wrong d)2 + (correct d)2
= 66 – (2)2 + (4)2
= 66 – 4 + 16
= 78
Hence, the Corrected value of rank correlation coefficient obtained is 0.53.
Corrected value of rank correlation coefficient:
r = 1 – \(\frac{6(\text { corrected }) \Sigma d^{2}}{n\left(n^{2}-1\right)}\)
= 1 – \(\frac{6(78)}{10\left(10^{2}-1\right)}\)
= 1 – \(\frac{468}{10(100-1)}\)
= 1 – \(\frac{468}{990}\)
= 1 – 0.47
= 0.53
Question 12.
The information of health index x and life expectancy y is obtained for 10 people. These data are ranked to find the rank correlation coefficient and the sum of squares of the ranks was found to be 42.5. It was also observed that health index 70 was repeated three times and life expectancy 45 was repeated twice in the data. Find the rank correlation coefficient using this information.
Answer:
Here, n = 10; Σd2 = 42.5, x = Health index and
y = Life expectancy
x = 70 repeated thrice, y = 45 repeated twice.
We calculate CF as follows:
Now, r = 1 – \(\frac{6\left(\sum d^{2}+\mathrm{CF}\right)}{n\left(n^{2}-1\right)}\)
Putting n = 10, Σd2 = 42.5, CF = 2.5 in the formula,
r = 1 – \(\frac{6(42.5+2.5)}{10\left(10^{2}-1\right)}\)
= 1 – \(\frac{6(45)}{10(100-1)}\)
= 1 – \(\frac{270}{990}\)
= 1 – 0.27
= 0.73
Hence, the rank correlation coefficient obtained is 0.73.