Gujarat Board Statistics Class 12 GSEB Solutions Part 1 Chapter 4 Time Series Ex 4 Textbook Exercise Questions and Answers.
Gujarat Board Textbook Solutions Class 12 Statistics Part 1 Chapter 4 Time Series Ex 4
Section A
Answer the following questions by selecting a correct option from the given options:
Question 1.
Which type of variations are produced in the time series variable due to seasonal component ?
(a) Long-term
(b) Irregular
(c) Regular
(d) Zero
Answer:
(c) Regular

Question 2.
Which variation is shown in ‘decrease in the production of a company’ due to strike ?
(a) Random
(b) Trend
(c) Seasonal
(d) Cyclical
Answer:
(a) Random
Question 3.
Name the method for fitting the linear equation to find linear trend.
(a) Graphical Method
(b) Method of least squares
(c) Method of moving average
(d) Method of partial average
Answer:
(b) Method of least squares
Question 4.
How do you show the additive model of the time series ?
(a) yt = Tt + St + Ct – Rt
(b) yt = Tt + St + Ct + Rt
(c) yt = Tt × St + Ct × Rt
(d) yt = St + Ct + Rt
Answer:
(b) yt = Tt + St + Ct + Rt
Question 5.
State the independent variable of time series,
(a) yt
(b) St
(c) t
(d) xt
Answer:
(c) t
Question 6.
Which component of the time series is impossible to predict ?
(a) Random component
(b) Trend
(c) Seasonal component
(d) Cyclical component
Answer:
(a) Random component
Question 7.
Which of the following variations are due to cyclical component ?
(a) Rise in demand during winter
(b) Decrease in the share prices due to recession in share market
(c) Decrease in the agricultural produce due to excessive rains
(d) Continuously decreasing death rate
Answer:
(b) Decrease in the share prices due to recession in share market
Question 8.
The trend equation obtained from a time series from January 2016 to December 2016 is ŷ = 30.1 + 1.5 t. Find the value of trend for April 2016.
(a) 30.1
(b) 34.6
(c) 36.1
(d) 33.1
Answer:
(c) 36.1
Question 9.
Which of the following fluctuations is the effect of seasonal component ?
(a) Increase in the migration to cities from rural areas
(b) Increasing number of vehicles on roads in a city
(c) Increase in the number of tourists during school vacation
(d) Increased death rate during a certain epidemic
Answer:
(c) Increase in the number of tourists during school vacation
Question 10.
Which method of finding trend is best to eliminate the effect of repetitive short-term variations ?
(a) Graphical method
(b) Method of least squares
(c) Karl Pearson’s method
(d) Method of moving average
Answer:
(d) Method of moving average
Section B
Answer the following questions is one sentence:
Question 1.
Give an example of time series having decreasing trend.
Answer:
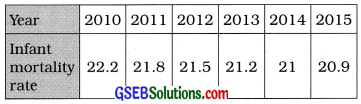
The time series of ‘Infant Mortality Rate’ in India is an example of time series having decreasing trend.
For example, infant mortality rate of India for the point 2010 to 2015 is given in the following table:
Question 2.
What is a time series ?
Answer:
A time series is a set of observation taken at specified time periods.
Question 3.
Which of the components of time series produce short-term variations ?
Answer:
The seasonal components and cyclical component of time series produce short-term variations.
Question 4.
What is meant by analysis of time series ?
Answer:
The method to obtain the estimates of different components of a time series is called analysis of time series.
Question 5.
What is the notation to show the cyclical component of the time series ?
Answer:
The notation to show the cyclical component of the time series is ‘Ct’.
Question 6.
State the names of methods of measuring trend.
Answer:
The methods of measuring trend are:
- Graphical method.
- Least square method and
- Moving average method.
Question 7.
The effect of which component indicates fluctuations repeating within one year ?
Answer:
The effect of seasonal component indicates fluctuations repeating within a year.
Question 8.
State the components of time series.
Answer:
The components of time series are :
- Long-term component or Trend,
- Seasonal component,
- Cyclical component and
- Random or Irregular component.
Question 9.
When is the method of moving average more useful to find trend?
Answer:
When the effect of short-term variations is to be eliminated to find trend, method of moving average is more useful.
Question 10.
The linear equation fitted using the data of 7 weeks for a variable y is ŷ = 25.1 – 1.3t. Estimate the value of y for the eighth week.
Answer:
ŷ = 25.1 – 1.3t
Putting t = 8, we get
ŷ = 25.1 – 1.3 (8)
= 25.1 – 10.4
= 14.7
Hence, the estimate of y for the eighth week obtain is ŷ = 14.7.
Section C
Answer the following questions:
Question 1.
Describe the additive model of time series.
Answer:
The additive model of time series is as follows :
yt = Tt + St + Ct + Rt
Where, yt = Time variable; Tt = Trend; St = Seasonal component; Ct = Cyclical component; Rt = Random component.
Question 2.
What is meant by cyclical component ?
Answer:
The variations occurring in the time series at approximately regular intervals of more than one year due to the effect of depression, recovery, boom, recession and business cycle are called cyclical variations known as cyclical component. It is denoted by ‘Ct‘.
→ The oscillation period for cyclical component can be 2 to 10 years. In specific circumstances it can also be 10 to 15 years.
Question 3.
How does seasonal component differ from the cyclical component ?
Answer:
Seasonal component and cyclical component differ in the following manner:
→ The variations occurring in the time series almost regularly over less than one year is the effect of seasonal component, while that of more than a year is the effect of cyclical component.
→ The period of oscillation of seasonal component is usually less than a year, while it can be 2 to 10 years and in special circumstances it can also be 10 to 15 years.
→ Seasonal component is the effect of natural factors and man-made factors, while cyclical component is the effect of economic situations and business cycles.
→ The increase in the sales of readymade garments and shoes daring festivals is an example of seasonal component while the cycles of boom and recession are the examples of cyclical component.
Question 4.
Explain the irregular component.
Answer:
In the variation of time series, seasonal component and cyclical component are regular component. More and above these there is effect
of irregular or random component which is short-term effect.
The element that remains after eliminating the trend Tt, Seasonal component St, Cyclical component Ct from the term yt of the time series is known as random or irregular component and is given by Rt = yt – (Tt + St + Ct).
Random component are subject to natural forces like flood, draught, earthquake, political crisis and random causes like fire, accident, etc. Sometimes it is seen on account of technological innovations.
Random component cannot be controlled nor can be predicted in advance. Hence the variable quantity yt of time series cannot be exactly predicted by studying the time series. Sometimes, effect of random component is temporary and transient. In such situation the stipulated targets of agricultural and industrial production cannot be achieved.
Question 5.
State the limitations of graphical method.
Answer:
The limitation of graphical method are as follows :
- In this method different people draw different curves. Hence, the uniformity is not maintained in the trend and its estimates.
- This is not a mathematical method. So it is not possible to know the reliability of the estimates.
- The exact form of the trend line of the series cannot be obtained by this method.
- When the plotted points of the time series are widely scatter from one another, then instead of drawing an unique curve of the trend of the time series, more than one curve can be drawn representing the trend.
Question 6.
Explain the meaning of moving average.
Answer:
The short term variations are usually regular and have repetitions. The period of repetition of these variations are fond and their average is found for the given time series.
→ This average of repetitions is known as the period of moving average. We find moving total of the variables of the given time series corresponding to the period of moving average.
→ Keeping the average value in the centre the average obtained by dividing moving total by the period of moving average is called moving average.
→ Suppose, the period of moving average is 3 years, then ‘3’ yearly moving average
= \(\frac{3 \text { ‘ yearly moving total }}{3}\)
→ Since the average value lies in the centre, we get the trend values that are free from short term variation.
→ If the period of moving average is odd number say 3. 5, 7, …, moving average can be calculated easily. If it is even number its calculation becomes some what difficult.
Question 7.
Define time series.
Answer:
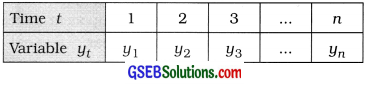
A time series is a set of observations taken at specified time period. Usually these observations are taken at equal internal of time.
→ Time t is taken as an independent variable and the dependent variable associated with it is yt. Thus, yt is a function of t. We shall represent the time series with different units of time as follows:
Question 8.
State the merits of the method of moving average to measure trend.
Answer:
The merits of the method of moving average to measure trend are as follows :
- The effect of short-term component is eliminated to a large extent and trend values of the time series are obtained.
- In this method the calculation to find trend is easy and it is simple to understand.
Question 9.
Describe the graphical method to measure trend.
Answer:
Suppose {yt: t = 1, 2, …, n} is a time series and n terms of the series are yt, y2, …, yn respectively. Taking the time t on X-axis and the term yt of the time series on Y-axis, the point (1, y1), (2, y2) … (n, yn) are plotted on the graph paper. Then points are joined by line segments. The graph so obtained is called the graph of the time series. A continuous curve passing from the viscinity of most of the points is drawn. The curve so obtained is called the trend line of the time series.
This is the simple and crude method of determining the trend of the time series. This method is quite easy to understand. But the mathematical form of the trend cannot be obtained by this method. When the plotted points of the time series are widely scatter from one another, it is difficult to draw an unique curve representing the trend of the time series. In such a situation, more than one curve can be drawn representing the trend of the time series. As a result it becomes difficult to determine the trend of the time series.
Section D
Answer the following questions as required:
Question 1.
Explain the importance of time series.
Answer:
The important reasons for the study of time series are as follows:
- The changes occuring in the values of the variable quantity of the time series indicate the situation that prevailed in the past and this knowledge becomes helpful in making decisions for the future.
- We can predict the future value or values of the variable quantity on the basis of the study of the time series.
- The policy decisions made on the basis of the study of time series, enable business firms, industrial houses and government organisations to formulate their development plans for future.
- The study of time series enable business firms, industrial houses and government organisation to compare their present performance of the economic activities with the past and make an assessment of the actual progress achieved. For example, the government can assess the changes occurred in the inflation rate on the basis of wholesale price index numbers during the five year plan period.
Question 2.
State the uses of analysis of time series.
Answer:
The analysis of time series is useful in trade, science, social and political fields as follows :
- It is possible to know the past situation and use it to obtain the type and measure of variation.
- By using statistical method the estimated value of the variable in future can be obtained.
- Using the estimated values proper decisions can be taken for the future and activities can be planned accordingly.
- A comparative study can be carried out for the variations in the given variable at different times and places.
- The estimated obtained from the past data can be compared with the present values and the reasons for discrepancies between them can be investigated.
Question 3.
What is meant by trend of a time series ? Explain with an illustration.
Answer:
Trend is an important component of a time series. It is the measure of permanent effect which prevails on the time series for a long period of time. Trend may be either increasing or decreasing or stable in terms of time. It represents the mathematical form and direction of variation taking place in the variable quantity yt of a given time series. It is denoted by the symbol yt’. Trend is the component obtained by eliminating the effect of short-term fluctuations (namely seasonal and cyclical) from the total fluctuations in the variable quantity of time series. In the time series of human population of any country the effect of trend is likely to be more pronounced than that of other components.
From the study of trend of a time series we can predicate a value of yt of the time series for some future value of t or we can determine the missing value for some past value of t. Also two or more sets of time series data can be compared with the help of their trends. Important decisions concerning economic policy can be taken on the basis of the trend of time series of economic data.
The estimate of the trend of time series can be obtained by the following two methods :
- Graphical method and
- Least squares method of fitting linear trend.
Question 4.
Write a short note on seasonal component.
Answer:
Seasonal component is short-term in nature and its effect is seen according to the seasons. The significant variations occured in the variable quantity of time series at fixed period of time in the year say winter, summer, monsoon. For example, a spurt in demand for woolen clothes in the winter, a spurt in the sale of ice-cream and cold drinks in the summer, increase in demand for umbrellas and raincoats in the monsoon, increase in the sale of readymade garments and footwears during the religions festivals, etc. are the illustration of seasonal fluctuation.
From the study of seasonal component traders and manufacturers of seasonal goods plan for periodical stocks to take care of the demand of such goods. Generally, the duration of oscillation of seasonal fluctuations is of one year. The seasonal component is denoted by the symbol St.
Generally the period of oscillation of seasonal component is less than a year. To study the seasonal component it is necessary to have the value of series in short-term. If the yearly values of the variable are available then it is not possible to obtain the information of seasonal component.
Question 5.
Explain the method of fitting a linear equation to the given data using the method of least squares.
Answer:
The data available in the form of time series {yt: t = 1, 2, …, n} are the bivariate data, where t is the independent variable and the variable quantity y is the dependent variable. From this data we have to obtain the linear trend that suits to the time series. According to linear regression model, we have to obtain the linear trend model yt = α + βt + ut, where t = 1, 2, …, n and ut is an error variable. According to the least squares method, we determine the values of the constants α and β in such a manner that the sum of the squares of error variable, i.e., Σe2 = Σ(yt – α – βt)2 is minimised. If ‘a’ and ‘b’ denote the estimated values of a and p respectively then ‘α’ and ‘β’ can be obtained by the following formulae:
b = \(\frac{n \Sigma t y-(\Sigma t)(\Sigma y)}{n \Sigma t^{2}-(\Sigma t)^{2}}\) and a = ȳ – bt̄
where, ȳ = \(\frac{\Sigma y}{n}\); t̄ = \(\frac{\Sigma t}{n}\); n = No. of observations
Thus, the fitting of trend line is given by ŷt = a + bt. From this trend line we can forecast the variable quantity y of the time series for the values of t following the time duration after t = n.
We can obtain the estimates of trend values for all the terms of the time series by this method. If for the given time series there is no linear trend, this method is not useful.
Question 6.
State the merits and limitations of the method of least squares.
Answer:
The merits and limitations of the least squares method of fitting the linear trend are as follows:
Merits:
- This method of determining the trend of the time series is mathematically more compact than the graphical method.
- In this method the estimates of the trend values for all the terms of the time series can be obtained.
- From the equation of linear trend of the time series, we can forecast the variable quantity yt for any value of t.
Limitations:
- This method of determining the trend of the time series is difficult than the graphical method from the calculation view point.
- If there is lack of linear trend in the time series, this method is not useful for fitting the linear trend.
Question 7.
Describe the method of moving average to find trend.
Answer:
The method of moving average is very useful to find trend by eliminating the effect of short-term variations.
→ The period of moving average : The short-term variation are usually regular and have repetition. The period of repetition of these variations can be found by observing the given time series. The average is found from the number of observations corresponding to this period which is known as the period of moving average.
→ Since the average value lie in the centre, the values obtained by this method show the trend.
→ Suppose the values of variable are y1, y2, …. yn corresponding to time t = 1, 2, …, n and the period of moving average is 3 years. Then the mean of first three observations y1, y2, y3 is found as \(\frac{y_{1}+y_{2}+y_{3}}{3}\) and it is written against the centre of these three observations which is y2. Further, the mean of successive three observation y2, y3, y4 is obtained and it written against y3. Similarly, finding successive moving total of three observations, averages are calculated. These average are called three yearly moving averages which indicate trend.
→ The period of moving average not necessarily every time is year. It may be 5 days, 4 weeks, 7 months, etc.
→ If time period of moving average is an even number say. 4, 6, … etc., then the process of finding moving average is to be done twice.
→ Suppose, the period of moving average is 4 years. The four yearly successive averages
\(\frac{y_{1}+y_{2}+y_{3}+y_{4}}{4}\), \(\frac{y_{2}+y_{3}+y_{4}+y_{5}}{4}\), \(\frac{y_{3}+y_{4}+y_{5}+y_{6}}{4}\) ……,
are written between y2 and y3, y3 and y4, y4 and y5 …. respectively since, these averages are in between two years, the average of each pair of averages is found and written between two moving average. Thus, the average of the first two averages will be written against y3. The averages thus obtained are called as four yearly moving average.
Question 8.
Discuss the limitations of the method of moving average.
Answer:
The limitation of the method of moving average are as follows :
- If the internal for moving, average is not chosen properly, then the trend obtained by this method is not accurate.
- In this method the estimates of trend for some initial and last time periods cannot be obtained.
- In this method a specific mathematical formula is not obtained for future estimates.
Question 9.
The following time series shows the daily production of a factory. Find the trend using graphical method.
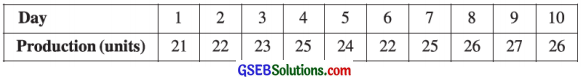
Answer:
Here, the unit of time is day. So t = 1, 2, 3, …. 10; y = production.
The given time series is written as shown in the following table :
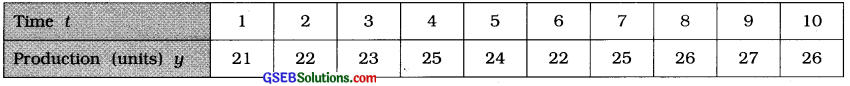
Taking t on X-axis and y on Y-axis points (1, 21), (2, 22), …… , (10, 26) are plotted on the graph paper. Joining these points serially by lines, the curve of the given series is obtained as follows:
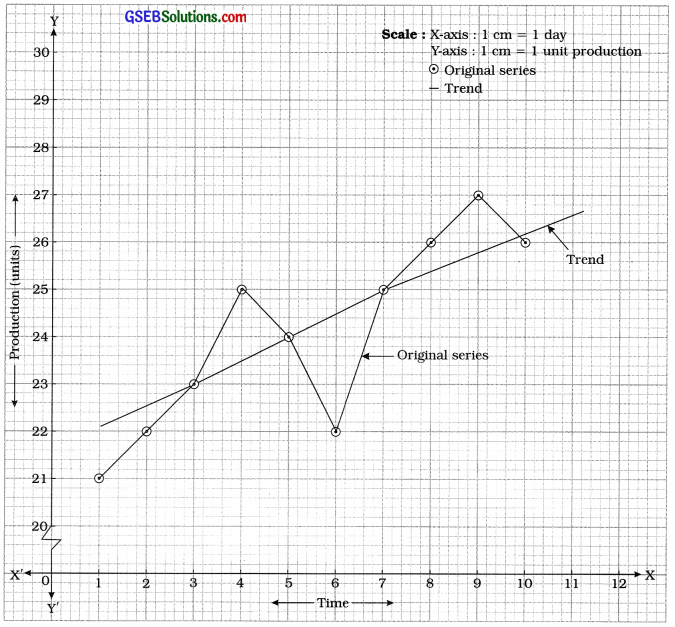
The curve passing through close to most of the points of the curve of original series is the curve showing the trend of given time series.
Question 10.
Fit a linear equation from the following data for variable (y) of a time series: n = 4, Σy = 270, Σty = 734
Answer:
n = 4 is given. So t = 1, 2, 3, 4
∴ Σt = 1 + 2 + 3 + 4=10 and
Σt2 = 1 + 4 + 9 + 16 = 30
Here, n = 4; Σt = 10; Σt2 = 30; Σy = 270; Σty = 734
∴ t̄ = \(\frac{\Sigma t}{n}\) = \(\frac{10}{4}\) = 2.5
ȳ = \(\frac{\Sigma y}{n}\) = \(\frac{270}{4}\) = 67.5
b = \(\)
Putting n = 4, Σty = 734, Σt = 10, Σy = 270, Σt2 = 30 in the formula,
b = \(\frac{4(734)-(10)(270)}{4(30)-(10)^{2}}\)
= \(\frac{2936-2700}{120-100}\)
= \(\frac{236}{20}\)
= 11.8
a = ȳ – bt̄
Putting ȳ = 67.5, b = 11.8 and t̄ = 2.5, we get
a = 67.5 – 11.8 (2.5)
= 67.5 – 29.5
= 38
Equation of linear trend:
Putting a = 38, b = 11.8 in ŷ = a + bt, we get ŷ = 38 + 11.8t
Hence, the equation of linear trend obtained is ŷ = 38 + 11.8t.
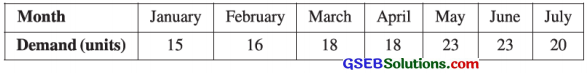
Question 11.
The data collected about the demand of a commodity from a store are as follows. Find the trend using three monthly moving averages.
Answer:
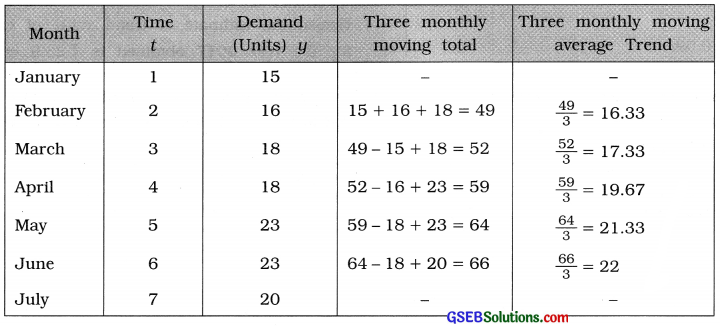
Here, n = 7 months. So t = 1, 2, ……….., 7; y = Demand.
To calculate three monthly moving average the following table is prepared:
Section E
Solve the following:
Question 1.
The data about exports (in crore ₹) of readymade garments of a textile manufacturer are shown below:
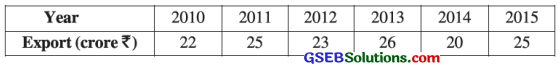
Fit a linear trend to these data and estimate the trend for the export in the year 2017.
Answer:
Here, n = 6 year. So t = 1, 2, …, 6; y = Export.
We fit the equation of linear trend ŷ = a + bt.
To calculate the values of a and b, the following table is prepared:
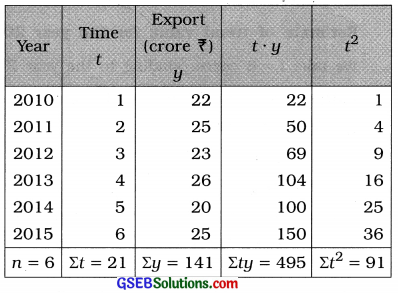
t̄ = \(\frac{\Sigma t}{n}\)
Putting n = 6 and Σt = 21, we get
t̄ = \(\frac{21}{6}\) = 3.5
ȳ = \(\frac{\Sigma y}{n}\)
Putting n = 6 and Σy = 141, we get
ȳ = \(\frac{141}{6}\) = 23.5
Now, b = \(\frac{n \Sigma t y-(\Sigma t)(\Sigma y)}{n \Sigma t^{2}-(\Sigma t)^{2}}\)
Putting n = 6; Σty = 495; Σt = 21; Σy = 141 and Σt2 = 91 in the formula,
b =\(\frac{6(495)-(21)(141)}{6(91)-(21)^{2}}\)
= \(\frac{2970-2961}{546-441}\)
= \(\frac{9}{105}\)
= 0.09
a = ȳ – bt̄
Putting ȳ = 23.5, b = 0.09 and t̄ = 3.5, we get
a = 23.5 – 0.09 (3.5)
= 23.5 – 0.315
= 23.5 – 0.32
= 23.18
Equation of linear trend:
Putting a = 23.18 and b = 0.09 in ŷ = a + bt,
we get
ŷ = 23.18 + 0.09t
Estimate of trend value of export of the year 2017:
We take t = 8, corresponding to the year 2017
Putting t = 8 in ŷ = 23.18 + 0.09t, we get
ŷ = 23.18 + 0.09 (8)
= 23.18 + 0.72 .
= ₹ 23.9 (crore)
Hence, the estimate of trend value of export for the year 2017 obtained is ₹ 23.9 crore.
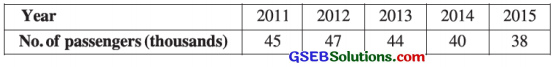
Question 2.
The following data are available for the number of passengers who travelled in the last 5 years by the aircrafts of an airline company. Estimate the trend for the year 2016 by fitting linear trend.
Answer:
Here, n = 5 years. So t = 1, 2, 3, 4, 5. y = No. of passangers.
We fit the equation of linear trend ŷ = a + bt.
To calculate the values of ‘a’ and ‘b’ the following table is prepared:
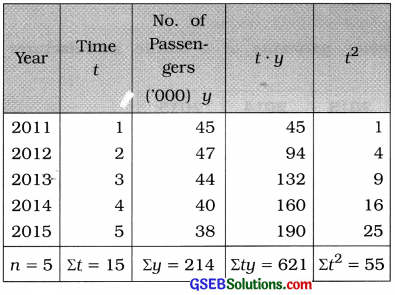
t̄ = \(\frac{\Sigma t}{n}\)
Putting n = 5 and Σt = 15, we get
t̄ = \(\frac{15}{5}\) = 3
ȳ = \(\frac{\Sigma y}{n}\)
Putting n = 5 and Σy = 214, we get
ȳ = \(\frac{214}{5}\) = 42.8
Now, b = \(\frac{n \Sigma t y-(\Sigma t)(\Sigma y)}{n \Sigma t^{2}-(\Sigma t)^{2}}\)
Putting n = 5; Σty = 621; Σt = 15; Σy = 214 and Σt2 = 55 in the formula,
b = \(\frac{5(621)-(15)(214)}{5(55)-(15)^{2}}\)
= \(\frac{3105-3210}{275-225}\)
= \(\frac{-105}{50}\)
= – 2.1
a = ȳ – bt̄
Putting ȳ = 42.8, b = – 2.1 and t̄ = 3.5, we get
a = 42.8 – (-2.1) (3)
= 42.8 + 6.3
= 49.1
Equation of linear trend:
Putting a = 49.1 and b = – 2.1 in ŷ = a + bt,
we get
ŷ = 49.1 – 2.11.
Estimate of trend value for the year 2016:
We take t = 6 corresponding to the year 2016.
Putting t = 6 in ŷ = 49.1 – 2.1 t, we get
ŷ = 49.1 – 2.1 (6)
= 49.1 – 12.6
= 36.5 (in ’000)
Hence, the estimate of trend value for the year 2016 obtained is 36.5 thousand.
Question 3.
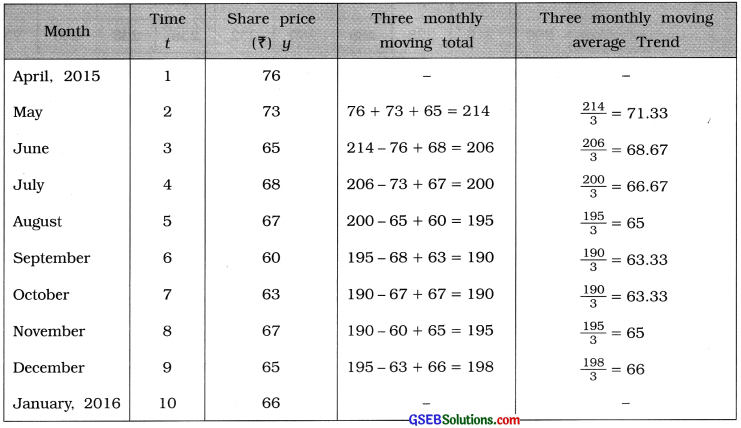
The data about closing prices of shares of a company registered in a stock exchange for different months is given in the following table. Find the trend using three monthly moving averages.

Answer:
Here, n = 10 months. So t = 1, 2, 3, …., 10; y = share price
To calculate three monthly moving average the following table is prepared:
Question 4.
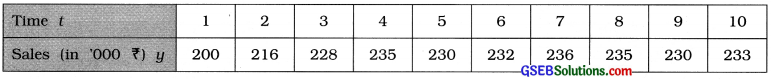
The following data show the sales (in thousand ₹) of a commodity. Find the trend by graphical method.

Answer:
Here, unit of time is year. n = 10; So t = 1, 2, 3, ……….., 10; y = sales.
The given time series is written as shown in the following table:
Taking t on X-axis and y on Y-axis, points (1, 200), (2, 216), …, (10, 233) are plotted on the graph paper. Joining these points serially by lines, the curve of the given time series is obtained as follows:
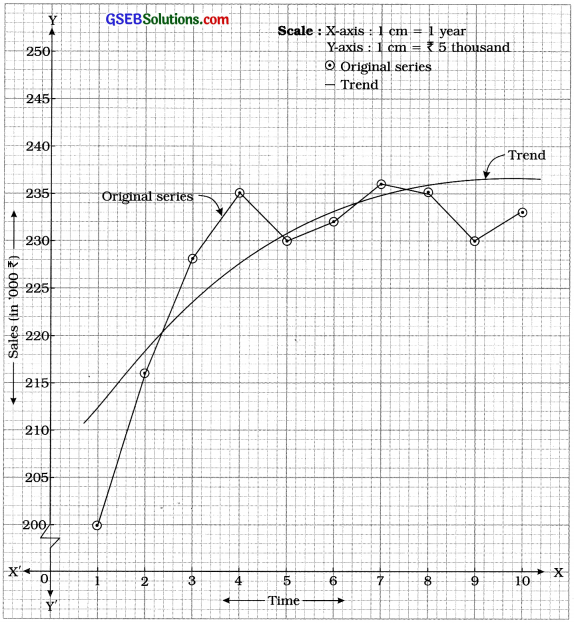
The curve passing through close to most of the points of the curve of original series is the parabolic curve showing the trend of given time series.
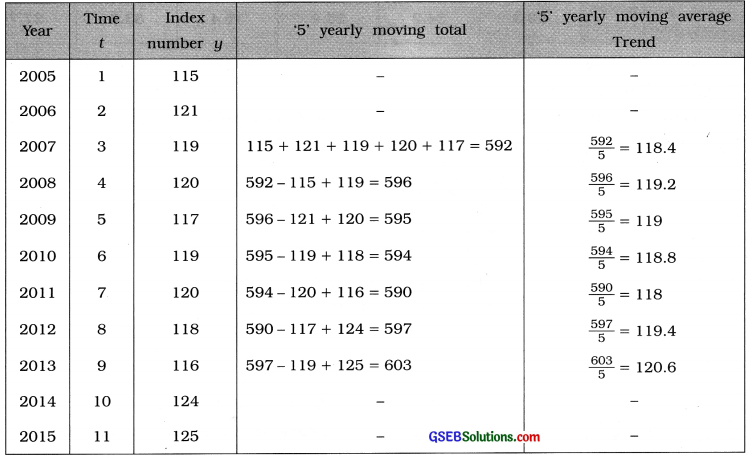
Question 5.
The quantity index numbers of consumption of edible oil in a state are given in the following table. Find the trend using five yearly moving averages.
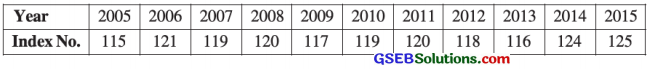
Answer:
Here, n = 11. So t = 1, 2, 3, ………. 11; y = Index number
To calculate 5 yearly moving average the following table is prepared:
Section F
Solve the following:
Question 1.
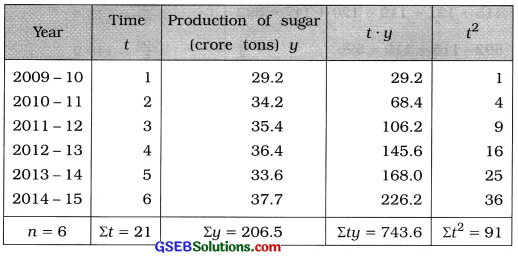
Find a linear equation using the method of least squares for the trend of production from the following data about sugar production of a country recorded for the last 6 years. Find the trend estimates for the production of the year 2016-17 and 2017-18.

Answer:
Here, n = 6 years. So t = 1, 2, 3, 4, 5, 6; y = production of sugar
We fit the equation of linear trend ŷ = a + bt.
To calculate the values of ‘a’ and ‘b’ the following table is prepared:
t̄ = \(\frac{\Sigma t}{n}\)
Putting n = 6 and Σt = 21, we get
t̄ = \(\frac{21{6}\) = 3.5
ȳ = \(\frac{\Sigma y}{n}\)
Putting n = 6 and Σy = 206.5, we get
ȳ = \(\frac{206.5}{6}\) = 34.42.
Now, b = \(\frac{n \Sigma t y-(\Sigma t)(\Sigma y)}{n \Sigma t^{2}-(\Sigma t)^{2}}\)
Putting n = 6; Σty = 743.6; Σt = 21; Σy = 206.5 and Σt2 = 91 in the formula,
b = \(\frac{6(743.6)-(21)(206.5)}{6(91)-(21)^{2}}\)
= \(\frac{4461.6-4336.5}{546-441}\)
= \(\frac{125.1}{105}\)
= 1.19
a = ȳ – bt̄
Putting ȳ = 34.42, b = 1.19 and t̄ = 3.5, we get
a = 34.42 – 1.19 (3.5)
= 34.42 – 4.16
= 30.26
Equation of linear trend:
Putting a = 30.26 and b = 1.19 in ŷ = a + bt,
we get
ŷ = 30.26 + 1.19t
Estimate of production of Sugar for the years 2016 – 17 and 2017 – 18 :
We take t = 8 and t = 9, corresponding to the years 2016-17 and 2017-18 respectively.
Putting t = 8 in ŷ = 30.26 + 1.19t, we get
ŷ = 30.26 + 1.19 (8)
= 30.26 + 9.52
= 39.78 (crore tons)
Putting t = 9 in ŷ = 30.26 + 1.19t, we get
ŷ = 30.26 + 1.19 (9)
= 30.26 + 10.71
= 40.97 (crore tons)
Hence, the estimates of production of Sugar for the year 2016-17 and 2017-18 obtained are 39.78 crore tons and 40.97 crore tons respectively.
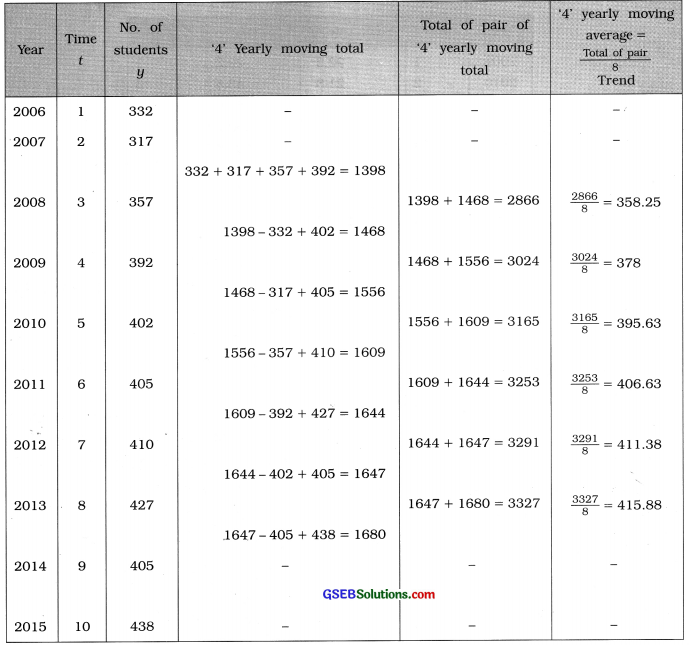
Question 2.
The number of students studying in a college are shown in the following table. Find the trend by four yearly moving averages.
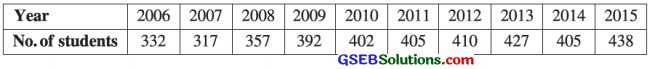
Answer:
Here, n = 10 year. So t = 1, 2, 3, …………, 10; y = No. of students
To calculate 4 yearly moving average the following table is prepared:
Question 3.
The birth rate of state in different years are given in the following table. Fit a linear trend of this data. Also find the estimates for birth rates in the year 2016 and 2017.
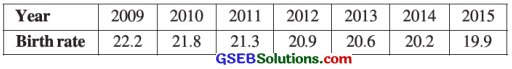
Answer:
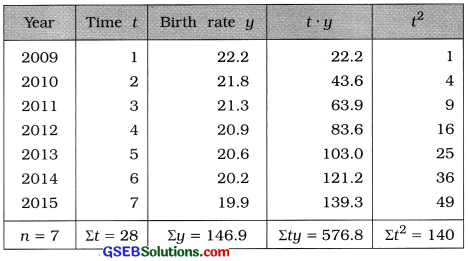
Here, n = 7 years. So t= 1, 2, 3, ………. 7. y = Birth rate.
We fit the equation of linear trend ŷ = a + bt.
To calculate the values of ‘a’ and ‘b’ the following table is prepared:
t̄ = \(\frac{\Sigma t}{n}\)
Putting n = 7 and Σt = 28, we get
t̄ = \(\frac{28{7}\) = 4
ȳ = \(\frac{\Sigma y}{n}\)
Putting n = 7 and Σy = 146.9, we get
ȳ = \(\frac{146.9}{7}\) = 20.99.
Now, b = \(\frac{n \Sigma t y-(\Sigma t)(\Sigma y)}{n \Sigma t^{2}-(\Sigma t)^{2}}\)
Putting n = 7; Σty = 576.8; Σt = 28; Σy = 146.9 and Σt2 = 140 in the formula,
b = \(\frac{7(576.8)-(28)(146.9)}{7(140)-(28)^{2}}\)
= \(\frac{4037.6-4113.2}{980-784}\)
= \(\frac{-75.6}{196}\)
= – 0.39
a = ȳ – bt̄
Putting ȳ = 20.99, b = – 0.39 and t̄ = 4, we get
a = 20.99 – (- 0.39) (4)
= 20.99 + 1.56
= 22.55
Equation of linear trend:
Putting a = 22.55 and b = -0.39 in ŷ = a + bt,
we get
ŷ = 22.55 – 0.39t
Estimates of birth rate for the years 2016 and 2017:
We take t = 8 and t = 9 corresponding to the years 2016 and 2017 respectively.
Putting t = 8 in ŷ = 22.55 – 0.391, we get
ŷ = 22.55 – 0.39(8)
= 22.55 – 3.12
= 19.43
Putting t = 9 in ŷ = 22.55 – 0.39 t, we get
ŷ = 22.55 – 0.39(9)
= 22.55 – 3.51
= 19.04
Hence, the estimates of birth rate for the years 2016 and 2017 obtained are 19.43 and 19.04 respectively.
Question 4.
The data about goods transported in different years by a division of railways are given below. Find the estimates for each year by fitting a linear equation and represent it by a graph. Also find the estimate for the year 2016.
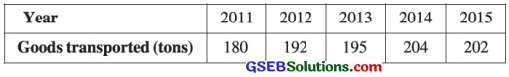
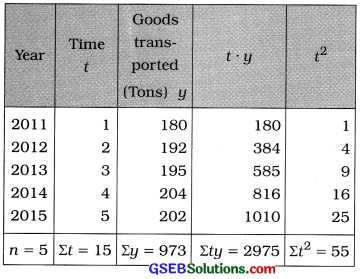
Answer:
Here, n = 5 years. So t = 1, 2, 3, 4, 5;
y = Goods transported
We fit a linear equation ŷ = a + bt.
To calculate the values of ‘a’ and ‘b’ the following table is prepared :
t̄ = \(\frac{\Sigma t}{n}\)
Putting n = 5 and Σt = 15, we get
t̄ = \(\frac{15}{5}\) = 3
ȳ = \(\frac{\Sigma y}{n}\)
Putting n = 5 and Σy = 973, we get
ȳ = \(\frac{973}{5}\) = 194.6.
Now, b = \(\frac{n \Sigma t y-(\Sigma t)(\Sigma y)}{n \Sigma t^{2}-(\Sigma t)^{2}}\)
Putting n = 5; Σty = 2975, Σt = 15; Σy = 973 and Σt2 = 55 in the formula,
b = \(\frac{5(2975)-(15)(973)}{5(55)-(15)^{2}}\)
= \(\frac{14875-14595}{275-225}\)
= \(\frac{280}{50}\)
= 5.6
a = ȳ – bt̄
Putting ȳ = 194.6; b = 5.6 and t̄ = 3, we get
a = 194.6 – 5.6 (3)
= 194.6 – 16.8
= 177.8
Equation of linear trend:
Putting a = 177.8 and b = 5.6 in ŷ = a + bt,
we get
ŷ = 177.8 + 5.6t
Estimates for each year:
| Year | Time t | ŷ = 177.8 + 5.6t |
| 2011 | 1 | 177.8 + 5.6 (1) = 183.4 |
| 2012 | 2 | 177.8 + 5.6(2) = 189.0 |
| 2013 | 3 | 177.8 + 5.6 (3) = 194.6 |
| 2014 | 4 | 177.8 + 5.6 (4) = 200.2 |
| 2015 | 5 | 177.8 + 5.6 (5) = 205.8 |
Estimate of goods transported for the year 2016:
We take t = 6 corresponding to the year 2016.
Putting t = 6 in ŷ = 177.8 + 5.6t, we get
ŷ = 177.8 + 5.6 (6)
= 177.8 + 33.6 = 211.4 (tons)
Hence, the estimate of goods transported for the year 2016, obtained is 211.4 tons.
Representation by graph:
Taking t = on X-axis and y on Y-axis, points (1, 180), (2, 192), …, (5, 202) are plotten on the graph paper. Joining these point serially by line segments, the curve of original series is obtained as follows :
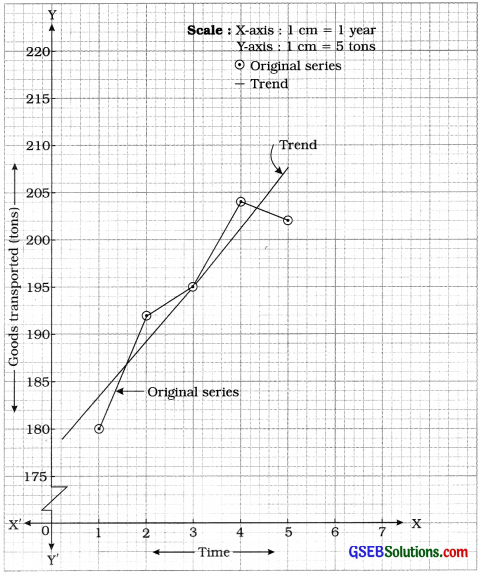
The curve passing through close to most of the points of original curve, is the curve of trend of the given time series. From the trend curve the estimate of goods transported for the year 2016 (i.e., t = 6) is obtained approximately 211 tons.
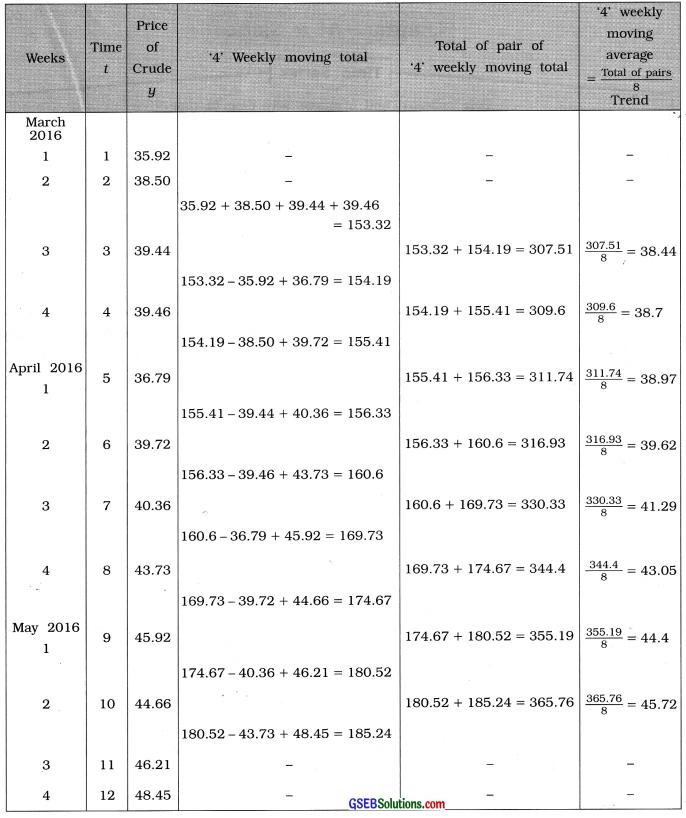
Question 5.
The data of weekly prices (in USD per barrel) of crude oil are given in the following table. Find the trend using four weekly moving averages.
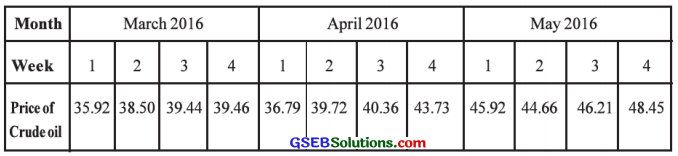
Answer:
Here, n = 12 weeks; 4 each of March 2016; April 2016 and May 2016.
So t = 1, 2, 3, …, 10, 11, 12; y = price of crude oil
To calculate 4 weekly moving average the following table is prepared: