Gujarat Board GSEB Textbook Solutions Class 6 Maths Chapter 9 Data Handling Ex 9.4 Textbook Questions and Answers.
Gujarat Board Textbook Solutions Class 6 Maths Chapter 9 Data Handling Ex 9.4
Question 1.
A survey of 120 school students was done to find which activity they prefer to do in their free time.
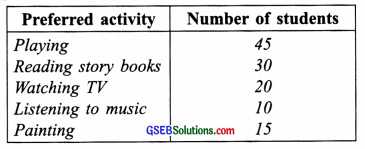
Draw a bar graph to illustrate the above data taking the scale of 1 unit length = 5 students.
Which activity is preferred by most of the students other than playing?
Solution:
Steps:
(i) Draw two perpendicular lines OX and OY.
(ii) Draw vertical bars (rectangles) of the same width keeping equal spacing between them.
(iii) ∵ 1 unit length = 5 students,
∴ Heights of bars will be
For playing = 45 ÷ 5 = 9 units
For reading story books = 30 ÷ 5 = 6 units
For watching TV = 20 ÷ 5 = 4 units
For listening to music = 10 ÷ 5 = 2 units
For painting = 15 ÷ 5 = 3 units
The required graph is as under:
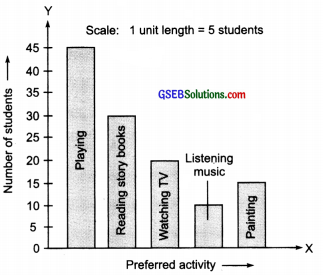
From the bar graph, the most preferred activity of the students is ‘Reading storybooks’ other than playing.
![]()
Question 2.
The number of Mathematics books sold by a shopkeeper on six consecutive days is shown below:
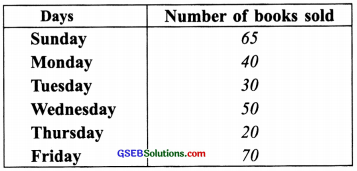
Draw a bar graph to represent the above information choosing the scale of your choice.
Solution:
Steps.
(i) Draw two perpendicular lines OX and OY.
(ii) Drawbars (rectangles) of equal width on OX having the same spacing between them.
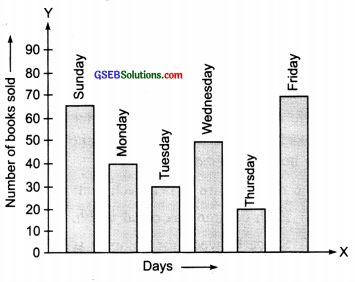
(iii) Taking an appropriate scale (here 1 unit length = 10 books) fix the heights of various bars, such as:
For Sunday = 65 ÷ 10 = 6.5 units
For Monday = 40 ÷ 10 = 4 units
For Tuesday = 30 ÷ 10 = 3 units
For Wednesday = 50 ÷ 10 = 5 units
For Thursday = 20 ÷ 10 = 2 units
For Friday = 70 ÷ 10 = 7 units
∴ The required bar graph is as follows.
![]()
Question 3.
The following table shows the number of bicycles manufactured in a factory during the years 1998-2002. Illustrate this data using a bar graph. Choose a scale of your choice.
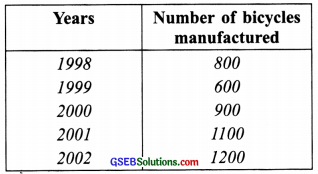
(a) In which year was the maximum number of bicycles manufactured?
(b) In which year was the minimum number of bicycles manufactured?
Solution:
Steps
(i) Draw two perpendicular lines OX and OY.
(ii) Drawbars of equal width on OX having the same spacing between them.
(iii) For fixing heights of various bars, choose an appropriate scale (here: 1 unit length = 200 bicycles) so that, we have:
For 1998: 800 ÷ 200 = 4 units
For 1999: 600 ÷ 200 = 3 units
For 2000: 900 ÷ 200 = 4.5 units
For 2001: 1100 ÷ 200 = 5.5 units
For 2002: 1200 ÷ 200 = 6 units
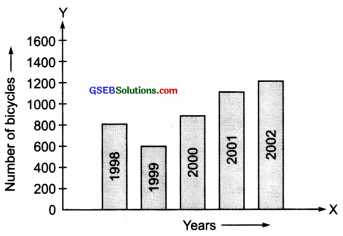
From the bar graph, we have:
(a) The maximum number of bicycles were manufactured in 2002.
(b) The minimum number of-bicycles were manufactured in 1999.
![]()
Question 4.
The number of persons in various age groups in a town is given in the following table.
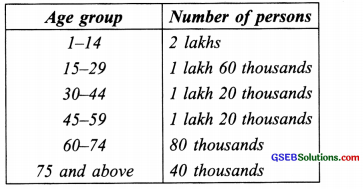
Draw a bar graph to represent the above information and answer the following questions. (take l unit length = 20 thousand)
(a) Which two age groups have the same population?
(b) All persons in the age group of 60 and above are called senior citizens. How many senior citizens are there in the town?
Solution:
Steps
(i) Draw two perpendicular lines OX and OY.
(ii) Drawbars of equal width on OX having the same spacing between them.
(iii) Since the scale is given:
1 unit length = 20 thousand person
∴ The heights of various bars are given below such as:
For 1-14 : 200000 ÷ 20000 = 10 units
For 15-29 : 160000 ÷ 20000 = 8 units
For 30-44 : 120000 ÷ 20000 = 6 units
For 45-59 : 120000 ÷ 20000 = 6 units
For 60-74 : 80000 ÷ 20000 = 4 units
For 75 and above : 40000 ÷ 20000 = 2 units
Now, the required bar graph is as follows.
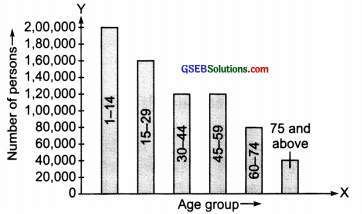
From the bar graph, we have:
(a) The age groups 30-44 and 45-59 have same population.
(b) Number of senior citizens (age group of 60 and above) are:
80,000 + 40,000 = 1,20,000