This GSEB Class 12 Commerce Accounts Notes Part 2 Chapter 5 Accounting Ratios and Analysis covers all the important topics and concepts as mentioned in the chapter.
Accounting Ratios and Analysis Class 12 GSEB Notes
In a business unit, financial statements are prepared on the basis of accounting information. Different accounting information shown in financial statements are not directly useful to various parties. For this, analysis of financial statements is useful. Analysis of financial statement creates the simplicity for understanding the information given in the financial statements. One of the efficient tool of analysis of financial statements is accounting ratios. Accounting ratios describe the inter-relation between different figures related to financial statements. Through which profitability and financial condition of a unit can be known. Since last some years, accounting ratios has obtained an important place for analysis of financial statements. In this chapter we will study about meaning, objectives of accounting ratio, analysis of accounting ratio and classification and calculation of accounting ratios.
Accounting Ratio:
Inter-relationship obtained by comparing different figures shown in financial statements in known as accounting ratio.
Presentation of Accounting Ratio:
The presentation of ratios can be done in different ways. These forms are as under:
- In terms of proportion
- In terms of presentage
- In terms of times
- In terms of fraction
- In terms of days/weeks/months.
![]()
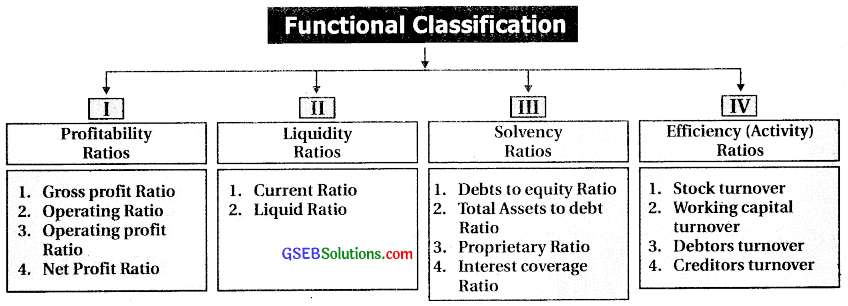
Classification of Ratios:
The Classification of ratios can be done into two categories:
- Traditional classification
- Functional classification.
(i) Traditional Classification: As per this classification the computation of accounting ratios is done on the basis of financial statements. As per this classification
- Ratios of trading A/c and Profit and Loss A/c
- Ratios of balance sheet
- Composite ratios are covered.
(ii) Functional Classification: As per this classification, calculation of accounting ratios can be done by taking different aspects of performance measurement of business entity like profitability, liquidity, solvency and efficiency into consideration.
As per new syllabus, study of functional classification is expected.
Gorss Profit Ratio:
This ratio discloses the relation between gross profit and total net sales. We can know that how much precentage of gross profit we earn on sales.
Gross Profit Ratio = \(\frac{\text { Gross Profit }}{\text { Total Net Sales }}\) × 100
- Gross Profit = Net sales – Cost of goods sold
- Net Sales = Total sales – Sale return
- Total Sales = Total cash sales + Total credit sales
- Cost of goods sold = Cost of goods consumed + Wages + Factory expenses
- Cost of goods consumed = Opening stock of raw material + Purchase of raw material + Purchase expenses – Closing stock of raw material
- Cost of goods sold = Sales – Gross profit OR Sales + Gross loss
- On the basis of gross profit ratio, gross profitability of a unit can be determined.
- This is income based ratio so its increasing trend indicates enhancement ¡n profitability
Operating Ratio:
Operating ratio discloses the relation of operating cost and sales. This ratio shows the proportion of operating cost to sales.
Operating Ratio = \(\frac{\text { Cost goods sold + Operating expenses }}{\text { Net Sales }}\) × 100
- Operating Expenses = Administrative (office) expense + Sales distribution expenses + Employees benefit expenses + Depreciation + Amount written off.
- Financial expenses are not included in operating expenses i.e. Interest paid on debenture and tax provision.
- Non-operating incomes like interest received, dividend received, Profit on sale of asset are not considered during the determination of operating cost.
- This ratio explains the operating cost of business entity in which the business is engaged.
- The decreasing trend of this ratio is favourable which indicates increasing operating profitability.
Operating Profit Ratio:
This ratio discloses relationship between operating profit and sales. This ratio shows the proportion of operating profit to sales.
Operating Profit Ratio = \(\frac{\text { Operating Profit }}{\text { Net Sales }}\) × 100
OR
Operating Profit Ratio = 100% – Operating Ratio.
- Operating Profit = Sales – Operating cost
- Operating Cost = Cost of goods sold + Operating expenses
- This ratio indicates that how much is profit erarend by the unit from the business in which unit deals.
- This ratio is income based ratio, so its increasing trend indicates the enhancement in profit.
Net Profit Ratio:
This ratio indicates the relationship between net profit and sales. This ratio shows the percentage of net profit to sales.
Net Profit Ratio = \(\frac{\text { Net Profit after tax }}{\text { Net Sales }}\) × 100
Net profit after tax can be find out as under:
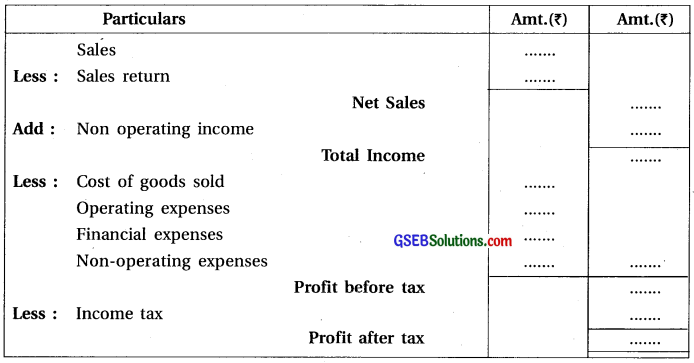
- While calculating net profit ratio, all types of income and expenses are taken into consideration.
- The overall profitability of business can be seen through this ratio.
- This ratio is income based ratio, so its increasing trend indicates the enhancement in total profitability.
![]()
Current Ratio:
Current ratio shows the relation between current assets and current liabilities. We can know the short term solvency of the business unit.
Current Ratio = \(\frac{\text { Current Assets }}{\text { Current Liabilities }}\)
- Current Assets = Stock (except loose tools) + Trade receivables (After deducing bad debts reserve from Debtors and bills receivable) + Current investments + Cash on hand + Bank balance + Cheque and Draft on hand + Short-term lending and advances + Expenses paid in advance + Outstanding incomes.
- Current Liabilities = Trade payables (bills payable + Creditors) + Short-term borrowings + Interest payable on long-term liabilities + Due but not paid liability + Due but not paid interest + Outstanding expenses + Uncalled dividend + Instalments and income received in advance.
- On the basis of current ratio we can know the capacity of business unit to pay current liabilities and also about the cash and liquid situation of the business.
- Generaly 2: 1 proportion of this ratio is considered to be an ideal.
Liquid Ratio:
Liquid ratio shows the relation between liquid assets and current liabilities. We can know about the capacity of the business unit to pay short term liabilities.
Liquid Ratio = \(\frac{\text { Liquid Assets }}{\text { Current Liabilities }}\)
- Liquid Assets = Current Assets – Stock Prepaid expenses
- The objective of this ratio is to measure liquidity and to measure capacity to pay short term liabilities.
- This ratio is also known as quick ratio.
- Generally proportion of this ratio 1: 1 is desirable.
Debt to Equity Ratio:
Debt to Equity ratio shows relation between debts and equity (Shareholders’ funds). The objective of this ratio is to know the proportion of owners capital (Shareholders’ funds) and borrowed funds (non-current liabilities) which are acquired by the business as a long term source of finance.
Debt to Equity Ratio = \(\frac{\text { Debt (Non Current/ Long Term Liabilities) }}{\text { Equity (Shareholders’ Funds) }}\)
- Shareholders’ Funds = Equity share capital + Preference share capital + Reserve and surplus
- Debit balance of Profit and Loss A/c. (if any)
- Non-current liabilities: Long term borrowings + Long term provisions
- Non-current liabilities = Total liabilities – Current liabilities
There is no standard measure for this ratio. This varies industry to industry.
- If this ratio in higher, it indicates that the business unit is more dependent on the borrowed fund and it is risky for the lenders,
- If this ratio is lower, it indicates that the business unit is less dependent on the borrowed fund and it is less risky for the lenders to lend their funds.
Total Assets to Debt Ratio:
This ratio shows relation between total assets and debt. Out of total assets, the proportion of assets acquired by debt, can be ascertained from this ratio.
Total Assets to Debt Ratio = \(\frac{\text { Total Assets }}{\text { Debt (Long Term Liabilities) }}\)
- To determine total assets, other non current assets are not to be considered.
- To determine debt, long term liabilities (Non-current) are to be considered.
- From this ratio, it can be ascertained that out of total assets, what proportion of total assets is acquired through non-current liabilities.
- There is no standard measure for this ratio.
- Generally when this ratio is higher, it is less risky to the lenders to lend their funds and if it is lower it is more risky to lend funds.
Proprietary Ratio:
This ratio shows the relation between the total assets and owner’s funds. By this ratio we can know that what proportion of total assets is acquired by owners funds.
Propritary Ratio = \(\frac{\text { Owners’ Funds }}{\text { Total Assets }}\)
- Owners’ Funds = Equity share capital + Preference share capital + Reserve and surplus – Debt balance of P & L A/c (if any)
- Owners’ Funds = Non-current Assets + Current Assets – Non-current liabilities – Current liabilities.
- This ratio provides the information of economic solvency and margin of safety to the creditors of business.
- If this ratio is higher then economic margin of safety also higher and if this ratio is lower then economic margin of safety is also lower.
![]()
Interest – Coverage Ratio:
This ratio shows the relation between the earing before interest and tax and the interest on long term debt. We can know about the capacity to pay the interest on long term liabilities.
Interest – Coverage Ratio = \(\frac{\text { Earning Before Interest and Tax }}{\text { Interest on long term debt }}\)
- On the basis of interest coverage ratio we can know about interest payment capacity of a business unit, on long term borrowed capital taken from external parties.
- If this ratio is higher then interest payment capacity also higher and it this ratio is lower then interest payment capacity is also lower.
Stock Turnover Ratio:
This ratio shows relation between the cost of goods sold and average stock. This ratio is the measurement of efficiency for the conversion of stock into sales
Stock Turnover = \(\frac{\text { Cost of goods sold }}{\text { Average stock }}\)
Average Stock = \(\frac{\text { Opening stock + Closing stock }}{2}\)
- On the basis of this ratio we can know that how many times stock is converted into cost of goods sold and finally into sales.
- It is established that higher the ratio higher the sale-higher the profit.
Working Capital Turnover Ratio:
This ratio shows the relation between sales and working capital. From this ratio it is ascertained that how many times the working capital generates sales.
Working Capital Turnover = \(\frac{\text { Sales/Cost of goods sold }}{\text { Net Working capital }}\)
Net Working Capital = Current Assets – Current Liabilities.
- If sales is not given in examples then cost of goods sold should be considered.
- This ratio is used to examine the efficiency of working capital.
- The increasing trend of this ratio shows efficient use of working capital, which is the cause of higher sales and higher profit.
Debtors’ Turnover Ratio:
This ratio shows the relation between credit sales and trade receivables. From this ratio it can be ascertained that how many times debtors and receivables emarg from credit sales.
Credit Sales
Debtor’s Turnover = \(\frac{\text { Credit Sales }}{\text { Average Trade Receivables }}\)
- Trade receivables means debtors for credit sales and amount of bills receivables.
- Average Trade Receivables = \(\frac{\text { Opening Trade Receivables + Closing Trade Receivables }}{2}\)
- While calculating trade receivables, bad debts reserve should not be deducted from debtors.
- On the basis of this ratio we can know about the efficiency of collection of trade receivables.
- Higher ratio shows the higher collection efficiency and lower investment in debtors and bills receivables and lower ratio shows the lower collection efficiency and higher investment in debtors and bills receivables.
- Collection Period: Month/Week/Days = \(\frac{12 / 52 / 365}{\text { Debtors’ Turnover }}\)
![]()
Creditor’s Turnover Ratio:
This ratio shows the relation between the credit purchase and trade payable. From this ratio it can be ascertained that how many times creditors and bills payables are emerged due to credit purchase and how quickly the payment is made.
Creditors’ Turnover = \(\frac{\text { Credit Purchase }}{\text { Average Trade Payables }}\)
- Trade payables means creditors for credit purchase and amount of bills payable.
- Average Trade Payables = \(\frac{\text { Opening Trade Payables + Closing Trade Payables }}{2}\)
- On the basis of this ratio we can know about the payment capacity of trade payables.
- Lower ratio shows higher payment efficiency and less investment in creditors and bills payable while higher ratio shows the lower payment efficiency and high investment in creditors and bills payables.
- Payment period: Month/Week/Days = \(\frac{12 / 52 / 365}{\text { Creditors’ Turnover }}\)
Following points are must remember while calculation of accountig ratio.
1. While finding out cost of goods sold, if opening stock and closing stock is not given but changes in stock is given then if this changes is positive then difference amount should be added to cost of goods sold and if the changes is negative then difference amount should deducted from cost of goods sold.
2. At the time of calculation of net profit, profit after tax should be considered.
3. Current assets and current ratio has direct relation and current liabilities and current ratio has inverse relation.
- Increase in current ratio
- Decrease in current ratio
- Decreases in current ratio
- Increase in current ratio
4. While calculation interest coverage ratio, Profit Before Interest and Tax (PBIT) should be considered.
5. While finding out stock turnover if average stock or cost of goods sold can’t be obtained then sales and closing stock should be considered.
6. While finding out working capital turnover if sales is not given then cost of goods sold should be considered.