Gujarat Board GSEB Textbook Solutions Class 8 Maths Chapter 5 Data Handling Ex 5.2 Textbook Questions and Answers.
Gujarat Board Textbook Solutions Class 8 Maths Chapter 5 Data Handling Ex 5.2
Question 1.
A survey was made of find the type of music that a certain group of young people liked in a city. Adjoining pie chart shows the findings of this survey?
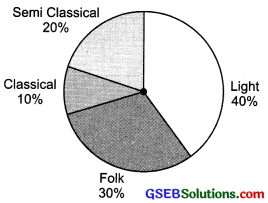
From this pie chart answer the following:
- If 20 people liked classical music, how many young people were surveyed?
- Which type of music is liked by the maximum number of people?
- If a cassette company wants to make 1000 CD’s how many of each type would they make?
Solution:
1. Let the required number of young people = x
∴ 10% 0f x = 20
or \(\frac{10}{100}\) × x = 20 or x = \(\frac{20×100}{10}\) = 200
2. Maximum number of people like the light music.
3. Total number of CD’s = 1000
∴ Number of CD’s for semi classical
= 20% of 1000
= \(\frac{20}{100}\) × 1000 = 200
Number of CD’s for classical
= 10% of 1000 = \(\frac{10}{100}\) × 1000 = 100
Number of CD’s for folks
= \(\frac{30}{100}\) × 1000 = 300
Number of CD’s for light music
= 40% of 1000 = \(\frac{40}{100}\) × 1000 = 400
![]()
Question 2.
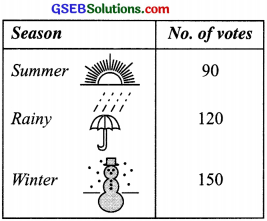
A group of 360 people were asked to vote for their favourite season from the three seasons rainy, winter and summer?
- Which season got the most votes?
- Find the central angle of each sector?
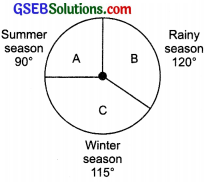
- Draw a pie chart to show this information?
Solution:
1. Number of votes are maximum (150) for the winter season.
2. Total votes = 90 + 120 + 150 = 360
∴ Central angle of the sector corresponing to:
Summer season = \(\frac{90}{360}\) × 360° = 90°
Rainy season = \(\frac{120}{360}\) × 360° = 120°
Winter season = \(\frac{150}{360}\) × 360° = 150°
3.
![]()
Question 3.
Draw a pie chart showing the following information. The table shows the colours preferred by a group of people?
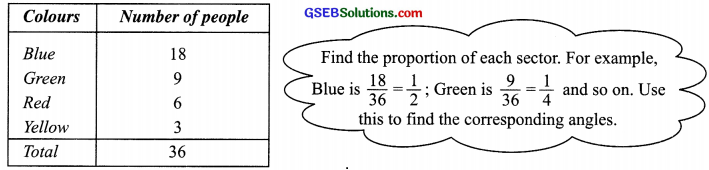
Solution:
Central angle of the sector corresponding to:
(a) The blue colour = \(\frac{18}{36}\) × 360°
= 18 × 10 = 180°
(b) The green colour = \(\frac{9}{36}\) × 360°
= 90°
(c) The red colour = \(\frac{6}{36}\) × 360° = 60°
(d) The yellow colour = \(\frac{3}{36}\) × 360° = 30°
Thus, the required pie chart is given below:
Question 4.
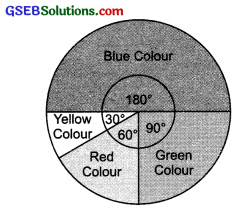
The adjoining pie chart gives the marks scored in an examination by a student in Hindi, English, Mathematics, Social Science and Science. If the total marks obtained by the student were 540, answer the following questions?
- In which subject did the student score 105 marks?
Hint: For 540 marks, the central angle = 360°. So, for 105 marks, what is the central angle? - How many more marks were obtained by the student in Mathematics than in Hindi?
- Examine whether the sum of the marks obtained in Social Science and Mathematics is more than that in Science and Hindi. Hint: Just study the central angles?
Solution:
1. Total marks = 540
∴ Central angle corresponding to 540 marks = 360°
Central angle corresponding to 105 marks
= \(\frac{360}{540}\) × 105° = 70°
Since the sector having central angle 70° is corresponding to Hindi.
Thus, the student obtained 105 marks in Hindi.
2. ∵ The central angle corresponding to the sector of Mathematics = 90°
∴ Marks obtained in Mathematics
= \(\frac{90}{360}\) × 540° = 135
Thus, marks more in Mathematics than in Hindi
= 135 – 105 = 30
3. Since, the sum of the central angles for Social Science and Mathematics
= 65° + 90° = 155°
Also, the sum of the central angles for Science and Hindi
= 80° + 70° = 150°
∵ Marks obtained are proportional to the central angles corresponding to various items and 155° > 150°.
∴ Marks obtained in Science and Mathematics are more than the marks obtained in Science and Hindi.
![]()
Question 5.
The number of students in a hostel, speaking different languages is given below. Display the data in a pie chart?
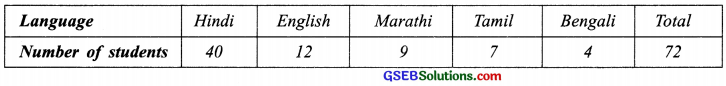 Solution:
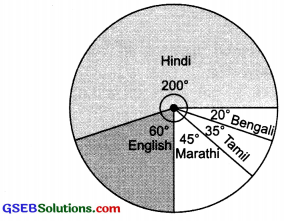
Central angle of the sector representing:
(a) Hindi language = \(\frac{40}{72}\) × 360° = 40 × 5° = 200°
(b) English language = \(\frac{12}{72}\) × 360° = 60°
(c) Marathi language = \(\frac{9}{72}\) × 360° = 45°
(d) Tamil language = \(\frac{7}{72}\) × 360° = 35°
(e) Bengali language = \(\frac{4}{72}\) × 360° = 4 × 5 = 20°
Thus, the required pie chart is given below: