Gujarat Board GSEB Textbook Solutions Class 8 Maths Chapter 15 Introduction to Graphs Ex 15.3 Questions and Answers.
Gujarat Board Textbook Solutions Class 8 Maths Chapter 15 Introduction to Graphs Ex 15.3
Question 1.
Draw the graphs for the following tables of values, with suitable scales on the axes?
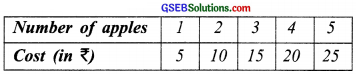
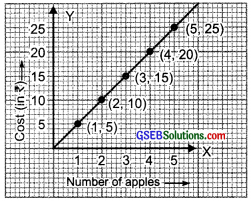
(a) Cost of apples
(b) Distance travelled by a car
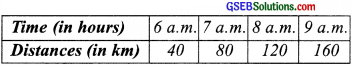
(i) How much distance did the car cover during the period 7.30 a.m. to 8 a.m.?
(ii) What was the time when the car had covered a distance of 100 km since its start?
(c) Interest on deposits for a year.
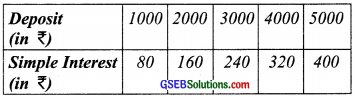
(i) Does the graph pass through the origin?
(ii) Use the graph to find the interest on ₹ 2500 for a year.
(iii) To get an interest of ₹ 280 per year, how much money should be deposited?
Solution:
(a)
I. Draw x-axis and y-axis mutually perpendicular to each other.
II. Take a suitable scale.
III. Take the number of apples along the x-axis and mark the cost (in ₹) along the y-axis.
IV. Plot me points (1, 5), (2, 10), (3, 15), (4, 20) and (5, 25)
V. Join the points.
We obtain the graph as a straight line.
(b)
I. Draw the axis.
II. Choose suitable scale along x-axis and y-axis.
III. Mark time (in hours) along x-axis and distance (in km) along y-axis.
IV. Plot the points (6, 40) (7, 80), (8, 120) and (9, 160).
V. By joining the points we get the required graph.
(i) In the graph, draw a perpendicular at the point indicating 7:30 a.m. on the x-axis such that it meets the graph at A. From A draw a line parallel to x-axis to meet y-axis at 100 km.
∴Distance travelled between 7:30 a.m. and 8:00 a.m.
= 120 km – 100 km = 20 km
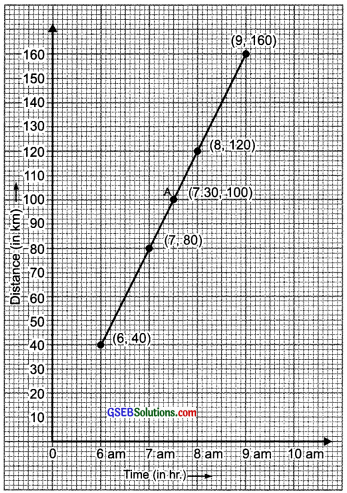
(ii) 7:30 a.m.
(c)
I. Draw axes.
II. Take appropriate scale on x-axis and y-axis.
III. Mark the deposits along the x-axis.
IV. Mark the interest along the v-axis.
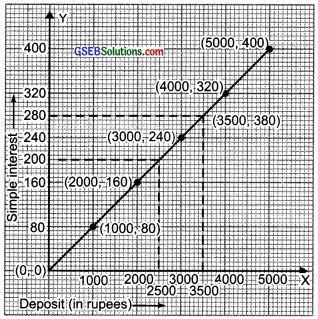
V. Plot the points (1000, 80), (2000, 160), (3000, 240), (4000, 320) and (5000, 400).
VI. Join the points and get the graph. Now from the graph, we have:
(i) Yes, it passes through the origin
(ii) From the graph, the interest on ₹ 2500 is ₹ 200.
(iii) From the graph an interest of ₹ 280 can be got by depositing ₹ 3500.
![]()
Question 2.
Draw a graph for the following.
(i)
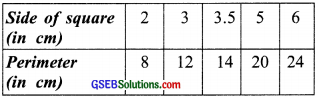
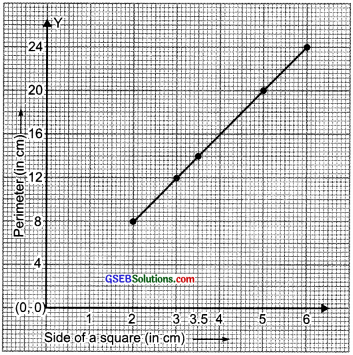
It is linear graph?
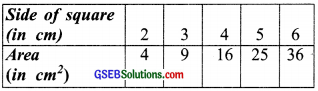
(ii)
Solution:
(i) Taking the side of the square along the x-axis and the perimeter along the y-axis and plotting the points (2, 8), (3, 12), (3.5, 14), (5, 20) and (6, 24), we get the required graph as a straight line.
∴ This graph is a linear graph.
(ii) Taking the side of the square along the x-axis and area (in cm2) along the y-axis, we can draw the required graph by plotting the points (2, 4), (3, 9), (4, 16), (5, 25) and (6, 36) as shown in the following figure.
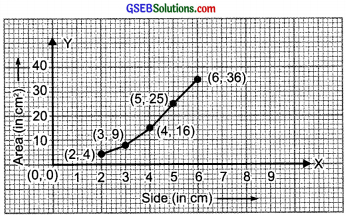
∵ The graph in not a straight line.
∴ It is not a linear graph.