GSEB Gujarat Board Textbook Solutions Class 11 Economics Chapter 1 Economics: An introduction Textbook Exercise Important Questions and Answers, Notes Pdf.
Gujarat Board Textbook Solutions Class 11 Economics Chapter 1 Economics: An introduction
GSEB Class 11 Economics Economics: An introduction Text Book Questions and Answers
1. Choose the correct option for the following from the options provided :
Question 1.
What is the science which studies human behaviour and deals with economic problems called?
(A) Philosophy
(B) Physics
(C) Economics
(D) Statistics
Answer:
(C) Economics
Question 2.
From which Greek word is economics derived?
(A) Oikonomikos
(B) Ecology
(C) PHILO
(D) NOMOS
Answer:
(A) Oikonomikos
Question 3.
Who is known to be the first economist to have started studying economics as a separate science?
(A) Kautilya
(B) Marshall
(C) Robbins
(D) Adam Smith
Answer:
(A) Kautilya
Question 4.
Who introduced economics as a real science?
(A) Adam Smith
(B) Robbins
(C) Samuelson
(D) Marshall
Answer:
(B) Robbins
Question 5.
In how many branches is economics classified by the method of study and analysis?
(A) Four
(B) three
(C) two
(D) five
Answer:
(C) two
![]()
Question 6.
On which axis are the independent variables like countries, year, rainfall, etc. usually represented?
(A) Vertical axis
(B) Horizontal axis
(C) On the point of origin
(D) On the corner of the graph
Answer:
(A) Vertical axis
Question 7.
Who has written the book ‘Principles of Economics’?
(A) Adam Smith
(B) Marshall
(C) Robbins
(D) Samuelson
Answer:
(B) Marshall
2. Answer the following questions in one sentence :
Question 1.
State the definition of economics given by Robbins.
Answer:
Economics is the science which studies human behaviour as a relationship between ends and scarce means which have alternative uses.
Question 2.
Which is the focus point of Samuelson’s definition of economics?
Answer:
Samuelson’s definition focuses on choice, allocation of source resources and evaluation of costs and benefits of doing so.
Question 3.
Which are the three ways of representing economic information?
Answer:
The information gathered through economic study or analysis can be represented in the following three ways.
- Descriptive manner
- Through data tables
- Through graphs or diagrams
Question 4.
On which axis are the independent and dependent variables usually represented?
Answer:
Generally, independent variables such as time are represented on X-axis whereas dependent variables are represented on Y-axis.
Question 5.
What is a pie diagram?
Answer:
Pie chart is a type of graph in which a circle is divided into sectors and each sector represents a proportion of the whole. The numerical data is proportionately converted into degrees in a circle and sectors are formed considering those degrees.
3. Answer the following questions in short :
Question 1.
Give Kautilya’s definition of economics.
Answer:
- About 2500 years ago, Kautilya who is also kr.own as Chanakya in his book ‘Arthshashtra’ discussed the purpose of economic activity undertaken by a state and society.
- According to Kautilya, the main intention of a human being is ‘arth’ (wealth). The piece of land on which a human settles is considered his ‘arth’ (wealth) and thus the science explaining the purpose and utility of wealth creation on earth is called economics.
Question 2.
Explain Marshall’s definition of economics.
Answer:
Alfred Marshall:
- In his book, ‘Principles of Economics’ published in 1890, Alfred Marshall gives the following definition ‘Economics is the study of mankind in the ordinary business of life’. This definition states that in everyday life people usually aim for material well-being.
- This definition explains economics as the study of routine activities of human beings and aims to explain how they achieve well-being from materialistic things.
- This definition does not have a broad aspect since it only focuses on the material consumption or material wellbeing, yet it is important as it keeps human wellbeing at the centre of human activity.
Question 3.
Explain the difference between economic and non – economic activities.
Answer:
| Economic activity | Non-economic activity |
| 1. An activity performed with the purpose of obtaining economic benefits in the form of income is called economic activity. | 1. An activity which is done without the purpose of obtaining economic gains is called non economic activity. |
| 2. Objective of making economic gains, satisfaction of some want and involvement of exchange and cost are important aspects of an economic activity. | 2. Unlike economic activities, such activities do not involve exchange of benefits on both sides of the transaction. |
| 3. Activities done by farmers, lawyers, teachers, actors, government, etc. are all example of economic activities. | 3. Charitable activity, or activities done out of love, affection, compassion, such as social service, mother teaching her son, etc. are all non economic activities. |
Question 4.
Specify the difference between microeconomics and macroeconomics.
Answer:
| Microeconomics | Macroeconomics |
| 1. Microeconorpjcsis. the study and analysis of economics at an individual, group or company level. | 1. Macroeconomics is the study of national economy as a whole. |
| 2. Macroeconomic analysis uses the ‘Principc of Marginalism to analyze how individual units make decisions in an economy. | 2. Macroeconomic analysis has helped to develop principles for managing resources in such a way that leads to increase in national income, reduce unemployment, poverty, inflation and so on. |
| 3. Determining price and wages. equilibrium output level for firm. etc. are studied here. | 3. Macroccanomics studies determining national income, unemployment, poverty, etc. |
Question 5.
“Statistical information is necessary to know the direction and condition of growth of an economy” explain.
Answer:
- Economics and statistics go hand in hand. In other words, one cannot do economic study without making use of statistics.
- Economics establishes several theories and hypothesis. One cannot directly believe these theories and put them in practice.
- We need to test the validity of such theories in real life at different times and places.
- To do so we need to gather information related to the established theory from real life activity at different times and places.
- Such information can be collected and presented in quantitative terms with the help of statistical tools.
- Information obtained from statistical analysis supports and confirms principles and theories laid by economics. This information also tells the direction and change in trends and growth or downward trend of economic parameters.
- Hence, statistical information is necessary to know the direction and condition of growth of an economy.
4. Answer the following questions in brief points :
Question 1.
Explain the definitions of economics by Adam Smith and Marshall.
Answer:
Adam Smith:
As per Adam Smith, ‘Economics is the study of the nature and causes of wealth of nations’. As per this definition, Economics studies the exchange of physical wealth produced by labour.
Adam Smith introduced economics as a Social Science. The reason for this was on one hand he studied human efforts (i.e. society) and on the other hand his methodology was scientific.
Since the time of Adam Smith, economics was studied as an independent science and not as part of general philosophy. He talked about human welfare in his book.
Alfred Marshall:
- In his book, ‘Principles of Economics’ published in 1890, Alfred Marshall gives the following definition ‘Economics is the study of mankind in the ordinary business of life’. This definition states that in everyday life people usually aim for material well-being.
- This definition explains economics as the study of routine activities of human beings and aims to explain how they achieve well-being from materialistic things.
- This definition does not have a broad aspect since it only focuses on the material consumption or material wellbeing, yet it is important as it keeps human wellbeing at the centre of human activity.
![]()
Question 2.
Give the points of importance of statistical information in the study of economics.
Answer:
Economics and statistics go hand in hand. In other words, one cannot do economic study without making use of statistics. The importance of statistical information in economics is discussed below.
1. Statistical information supports or confirms a principle:
- While performing an economic study, the approach can be divided in two parts. They are:
- The philosophy of economics: The philosophy of economics observes human behavior.
- Scientific tools of economics: These tools are used to establish principles and theories.
- One cannot directly believe the established theories and put them in practice.
- We need to test the validity of such theories in real life at different times and places. To do so we need to gather information related to the established theory from real life activity at such different times and places. Such information can be collected and presented in quantitative terms with the ‘ help of statistical tools.
Example:
(a) Based on the economic studies, a theory has been established between the cause and effect of rainfall and agriculture.
By collecting and analyzing statistical data on rainfall and agricultural production in a region at one time or at different times one can understand the cause-effect relationship theory established.
(b) Similarly, statistical data on price of a commodity and its demand can help to confirm the theoretical relationship established by economics between the two.
2. Statistical information gives an idea about the changing trends of economic parameters:
With the help of statistical data obtained under economic study, we can obtain an idea of the direction and magnitude of change in economic- parameters.
Example:
- We can know how sales revenue of a particular firm is changing
- We can know the trends of employment in a nation
- We can know the trends of production in different sectors of an economy
- For example, using economic study one may say that agricultural production is falling which is affecting national income or supply of money is rising in the economy.
- Such data help government to make proper economic policies. People may also take benefit of such data and policies and change their production patterns.
3. To make comparative study easy:
If appropriate statistical data are obtained then we can compare several parameters over different time periods, across regions and also across nations.
Example:
- We can compare growth rate of India’s national income between 1951 and 2015.
- We can also compare India’s macroeconomic parameters like per capita income, inflation etc. with those of other countries like USA, UK, China, etc.
4. To make precise presentation of facts:
- A picture is worth thousand words and this applies to economics too. At times facts about economic parameters can be represented more clearly with the help of statistical data and graphs. _
- Graphs showing inflation, agricultural production, regional disparities in incomes, etc. can give clearer picture of their trends as compared their written description.
- Such pictorial and graphical representations can be understood easily even by layman.
Question 3.
Give an idea regarding Indian economic thought.
Answer:
Indian history and culture are almost more than 5000 years old. So Indian philosophy depicts various aspects of our rich culture and human life and provides insights into ‘a way of life’.
In Hinduism there is a concept of ‘Purushartha’ (Gujarati: In Indian philosophy, Purushartha means ‘Purpose of a human being’ and it refers to the four goals or aims of a human life.
These goals are:
- ’Dharma’ (righteousness, duty)
- ‘Arth’ (purpose, benefit, wealth)
- ‘Kama’ (desire) and
- ‘Moksha’ (liberation).
- Out of these four goals, the activities of life done for ‘arth’ (benefits) are the subject matter of economics.
- Thus, any activity done with the purpose of obtaining some benefit is called an economic activity. ‘Arth’ is one of the four goals or duties of a human being to create wealth as a means of living and for material pleasures.
- About 2500 years ago, Kautilya who is also known as Chanakya in his book ‘Arthshashtra’ discussed the purpose of economic activity undertaken by a state and society.
- According to Kautilya, the main intention of a human being is ‘arth’ (wealth). The piece of land on which a human settles is considered his ‘arth’ (wealth) and thus the science explaining the purpose and utility of wealth creation on earth is called economics.
Question 4.
Clarify the importance of economics.
Answer:
Importance of economics:
- In modern world with continuous increase in use of goods and their scarcity almost all goods of human needs have become economic goods. As a result, all activities of human beings are increasingly becoming economic activities.
- Owing to these reasons, the importance of economics as a philosophy as well as a science is increasing in human life.
- Economics is extremely important to understand behaviour of human beings, society as well as state while managing every day activities and scientific theories and principles that guide professional decision making.
The various aspects that show the importance of economics are discussed below:
1. For understanding everyday behaviour:
Economics is useful for understanding everyday behaviour of human beings, society and state while managing routine tasks.
Economics helps in understanding everyday behaviour in the following ways:
(A) Understanding international events:
- Some international events affect lives of people in several countries like USA, Russia, China, etc.
- For example, people try to understand the impact of rise in price of crude oil in international market on their own cost of living.
- Some people also try to understand why some countries are more developed and others are less developed.
- Today, a very large amount of data is available for various events and situations of the entire world. Studying this data helps to continuously improve technology and the scope of economics in everyday life.
(B) Understanding historical events:
- Knowledge of economics helps to understand historical events better.
- By studying historical events with an approach of economics, one can better understand the reasons behind wars, the entry of East India Company in India for trade and the establishment of ‘British Raj’, India’s revolt against goods made in England during British Rule, labour movements, etc.
2. Economic importance:
(A) Decision making by individuals:
- People from all walks of life like households, lawyers, actors, singers and others try to get maximum gains from the efforts which they make.
- They try to manage their time and resources in an optimum manner to increase their gains. This means that they try to make such economic decisions that give them best returns.
(B) Understanding government policies:
- Knowledge of economics is extremely useful to understand various government policies related to taxation, wages, human resource, etc.
- Based on their understanding of these polices individuals and firms take their business decisions.
Example:
The bank rates i.e. REPO and Reverse REPO Rates declared by the Reserve Bank of India helps in making decisions regarding saving and investment.
(C) Professional decision making:
- Economics helps in knowing scientific principles and theories which in turn guides for making professional decisions.
- For example, revenue and cost as well as demand and supply are economic concepts used in all types of economic activities.
- Certain economic theories help businesses in making day to day decisions related to price determination, wage determination, employment of various factors of production and so on.
- Economics also provides knowledge regarding the impact of certain decisions. For example, it provides insights into questions like, what happens, if price gets reduced in market owing to very high competition?
- Economics is also a science which helps individuals for making their daily decisions.
- Every human being in their lives play roles of a consumer, producer or labour from time to time. Economics helps them to take logical decisions so that they can get maximum gains by minimizing costs.
- For example, whenever we want to buy vegetables, mobile phones, go out on vacation, etc. we use our knowledge of basic economics to gain maximum returns with minimum costs.
5. Answer the following questions in detail :
Question 1.
Give an idea of the development of economics as a science in the west.
Answer:
- Greek philosopher Aristotle gave his views on economics in his book ‘Oeconomica’,
- With the rise of industrial revolution in the west, the division of labour and specialization were introduced in the industrial sector. Under these concepts a piece of work was done by a worker or a group of workers who specialized only in that particular job.
- Owing to such concepts and logics the knowledge of philosophy started getting classified into various specialized sciences.
- Social Science started getting developed as a special branch just like other branches of science like Physics and Mathematics.
- The methodologies of Social Science were no longer based purely upon descriptive logic. Studies under Social Sciences were now backed up with ‘ scientific tools and methods.
- Hence studying human activities with a purpose was not solely a subject matter of political or social philosophy but it also developed as an independent science.
- Adam Smith did a deep thoughtful study on the creation of wealth and in 1776 wrote a book titled ‘An Inquiry into the Nature and Causes of Wealth of Nations’. The book is popularly known as ‘Wealth of Nations’.
- With this book Adam Smith developed Economics as a specialized area of knowledge in the west.
- By adopting the theories and principles of economics, the industries started using the newly introduced machines and made huge investments for mass production. As a result, the Industrial Revolution created a new socio-economic way of life and new methods of wealth creation.
![]()
Question 2.
‘Graphs/diagrams are a better method of precisely presenting economic information.’ Explain.
Answer:
- On performing economic study several data is generated. The numerical data so generated can be represented in different types of graphs and diagrams.
- Diagrams showing linear and non-linear relations are quite common in economics. The demand curve is one such diagram.
- Some other types of charts/graphs/diagrams used frequently in economics are:
(A) Bar diagram,
(B) Grouped bar diagram,
(C) Pie diagram, etc.
(A) Bar diagram:
A bar diagram (also known as bar chart or bar graph) is a diagram which represents grouped data in rectangular bars. The lengths of the bars are proportional to the values which they represent.
Example:
A bar diagram is produced from the data of production of wheat in India.
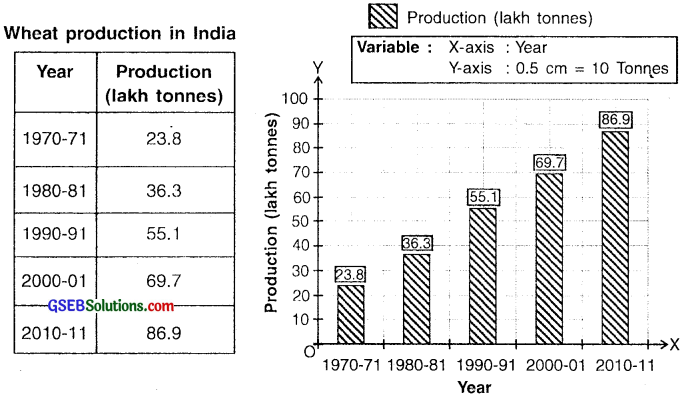
Representation of data in a bar graph
(B) Grouped/Clustered bar diagram:
These charts are used when the dependent variable is grouped in more than one category.
Example:
- We can create a clustered bar diagram if we want to study the literacy rates of ‘Males’, ‘Females’ and ‘Total literacy’ of Gujarat for different years.
- Here, we create combined bar for three categories in one group for one year. Bar for each category can be shaded or coloured differently to distinguish them.
Literacy rate in Gujarat (in percentage)
| Years | Male | Female | Total |
| 1951 | 30.17 | 12.79 | 21.09 |
| 1961 | 48.73 | 12.77 | 36.19 |
| 1971 | 53.78 | 29.00 | 41.84 |
| 1981 | 65.10 | 38.50 | 52.20 |
| 1991 | 73.13 | 48.64 | 61.29 |
| 2001 | 80.50 | 58.60 | 69.14 |
| 2011 | 87.23 | 70.73 | 79.31 |
Source: Socio-economic survey of Gujarat: 2011-12
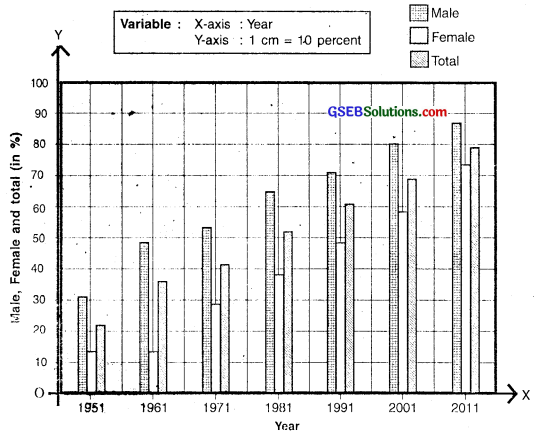
Representation of data in a grouped/clustered bar graph
(C) Pie Chart/Diagram:
- Pie chart is a type of statistical graph in which a circle is divided into sectors and each sector represents a proportion of the whole.
- The numerical data is proportionately converted into degrees in a circle and sectors are formed considering those degrees.
Example:
The contribution of different sectors namely agriculture, service and industry in India’s national income can be represented in a pie chart as shown here.
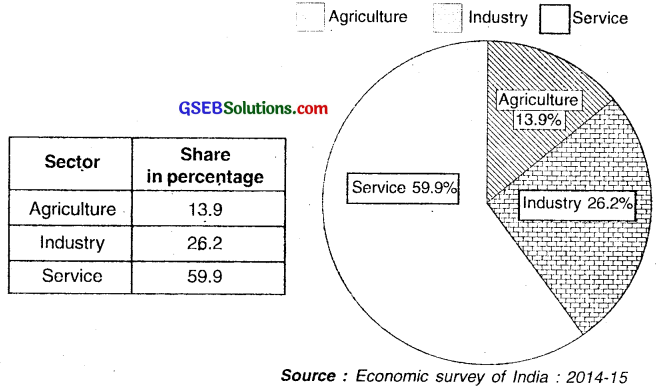
Representation of numerical data in a pie diagram