Gujarat Board GSEB Textbook Solutions Class 6 Maths Chapter 9 Data Handling Ex 9.3 Textbook Questions and Answers.
Gujarat Board Textbook Solutions Class 6 Maths Chapter 9 Data Handling Ex 9.3
Question 1.
The bar graph is given shows the amount of wheat purchased by the government during the year 1998-2002.
Read the bar graph and write down your observations. In which year was
(a) the wheat production maximum?
(b) the wheat production minimum?
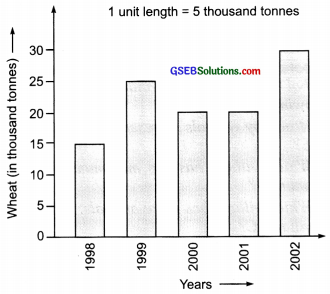
(a) In 2002, the wheat production was maximum.
(b) In 1998, the wheat production was minimum.
![]()
Question 2.
Observe the bar graph which is showing the sale of shirts in a ready-made shop from Monday to Saturday.
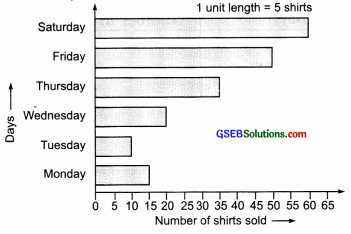
Now, answer the following questions:
(a) What information does the above bar graph give?
(b) What is the scale chosen on the horizontal line representing a number of shirts?
(c) On which day were the maximum number of shirts sold? How many shirts were sold on that day?
(d) On which day were the minimum number of shirts sold?
(e) How many shirts were sold on Thursday?
Solution:
(a) This bar graph gives the number of shirts sold from Monday to Saturday.
(b) Scale on the horizontal line is 1 unit = 5 shirts.
(c) the Maximum number of shirts were sold on Saturday. 60 shirts were sold.
(d) Tuesday
(e) 35 shirts
![]()
Question 3.
Observe this bar graph which shows the marks obtained by Aziz in half-yearly examination in different subjects.
Answer the given questions.
(a) What information does the bar graph give?
(b) Name the subject in which Aziz scored maximum marks.
(c) Name the subject in which he has scored minimum marks.
(d) State the name of the subjects and marks obtained in each of them.
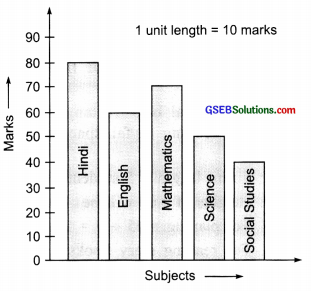
Solution:
(a) This bar graph represents the marks obtained by Aziz in different subjects.
(b) Maximum marks are obtained in Hindi.
(c) Minimum marks are obtained in Social Science.
(d) Subjectwise marks are:
Hindi: 80;
English: 60;
Mathematics: 70;
Science: 50;
Social Science: 40