Gujarat Board GSEB Textbook Solutions Class 8 Maths Chapter 15 Introduction to Graphs Intex Questions and Answers.
Gujarat Board Textbook Solutions Class 8 Maths Chapter 15 Introduction to Graphs
Try These (Page 243)
Question 1.
The number of litres of petrol you buy to fill a car‘s petrol tank will decide the amount you have to pay. Which is the independent variable here? Think about it?
Solution:
Since, quantity of petrol is a need whereas the amount of money is linked with the quantity of petrol.
∴ Petrol is the independent variable.
![]()
Try These (Page 243)
Question 1.
The following table gives the quantity of petrol and its cost?
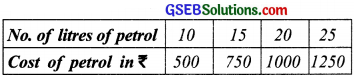
Plot a graph to show the data.
Use the graph to fInd how much petrol can be purchased for ₹ 800.
Solution:
We draw axes and take a suitable scale on both the axes. To draw the graph, we take the following steps:
I. Mark the number of litres of petrol along the horizontal axis.
II. Mark the cost of petrol (in rupees) along the y-axis.
III. Now, we plot the given points. i.e..
(10, 500); (15, 750); (20, 1000); (25, 1250)
IV. Join the points.
We find that the graph is a Straight tine.
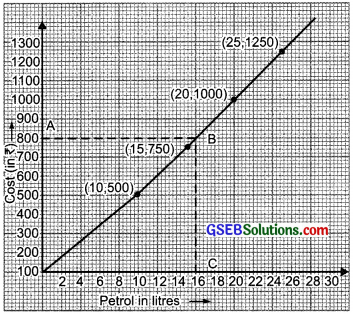
Yes, we can find the quantity of petrol to be got in ₹ 800, for this take a point on the y-axis (0, 800). Through B draw AB parallel to x-axis to meet the graph at B. Now from B, draw BC perpendicular to x-axis. As C corresponds to (16, 0).
Thus, 16 litres of petrol can be bought for ₹ 800.